Change Detection and Image Time Series Analysis 2
Здесь есть возможность читать онлайн «Change Detection and Image Time Series Analysis 2» — ознакомительный отрывок электронной книги совершенно бесплатно, а после прочтения отрывка купить полную версию. В некоторых случаях можно слушать аудио, скачать через торрент в формате fb2 и присутствует краткое содержание. Жанр: unrecognised, на английском языке. Описание произведения, (предисловие) а так же отзывы посетителей доступны на портале библиотеки ЛибКат.
- Название:Change Detection and Image Time Series Analysis 2
- Автор:
- Жанр:
- Год:неизвестен
- ISBN:нет данных
- Рейтинг книги:4 / 5. Голосов: 1
-
Избранное:Добавить в избранное
- Отзывы:
-
Ваша оценка:
Change Detection and Image Time Series Analysis 2: краткое содержание, описание и аннотация
Предлагаем к чтению аннотацию, описание, краткое содержание или предисловие (зависит от того, что написал сам автор книги «Change Detection and Image Time Series Analysis 2»). Если вы не нашли необходимую информацию о книге — напишите в комментариях, мы постараемся отыскать её.
Change Detection and Image Time Series Analysis 2 — читать онлайн ознакомительный отрывок
Ниже представлен текст книги, разбитый по страницам. Система сохранения места последней прочитанной страницы, позволяет с удобством читать онлайн бесплатно книгу «Change Detection and Image Time Series Analysis 2», без необходимости каждый раз заново искать на чём Вы остановились. Поставьте закладку, и сможете в любой момент перейти на страницу, на которой закончили чтение.
Интервал:
Закладка:
1.3.2. Results of the second method
Two very-high-resolution time series, acquired again over Port-au-Prince, Haiti, were used for experiments with the second proposed method. They both consist of Pléiades pansharpened data at a spatial resolution of 0.5 m (see Figures 1.7(a) and 1.8(a)), of HH-polarized X-band COSMO-SkyMed spotlight data at a resolution of 1 m (see Figures 1.7(b) and 1.8(b)) and of HH-polarized C-band RADARSAT-2 ultrafine data with a pixel spacing of 1.56 m (see Figures 1.7(c) and 1.8(c)). The acquisition dates of the three images in the series were a few days apart from one another. They correspond to two different sites in the Port-au-Prince area, which are shown in Figures 1.7 and 1.8 and are related to 1000 × 1000 and 2400 × 600 pixel grids at the finest resolution, respectively. The main classes in the two scenes are the same as in the previous section. Training and test samples associated with the two sites and annotated by an expert photointerpreter were used to train the second proposed method and to quantitatively measure its performance. The pixel grid at a resolution of 0.5 m of the Pléiades image was used as the reference finest resolution, and the RADARSAT-2 image was slightly resampled to a pixel spacing of 4 · 0.5 = 2 m in order to match the power-of-2 structure associated with the quad-tree (see also Figure 1.5). Antialiasing filtering was applied within this minor downsampling from 1.56 to 2 m, which is expected to have a negligible impact on the classification output, since the resolution ratio between the original and resampled images is close to 1.
In principle, the second proposed method can be applied in two distinct ways that differ in the ordering of the two SAR data sources in the two quad-trees, i.e. the COSMO-SkyMed image in the first quad-tree and the RADARSAT-2 image in the second one or vice versa. Preliminary experiments, which we omit for brevity, indicated that this choice of order did not have relevant impact on the output classification map.
Quite accurate performance was obtained on the test samples by the proposed method in the case of the multimission, multifrequency and multiresolution fusion task addressed in the present experiment (see Table 1.2). The maps obtained from the classification of the compound COSMO-SkyMed/RADARSAT-2/Pléiades time series of the two sites also exhibited remarkable spatial regularity (see Figures 1.7(g) and 1.8(g)). In this experiment, rather low accuracy was also achieved in the case of the “containers” class, again because of its overlapping with the “urban” class in the multisensor feature space.
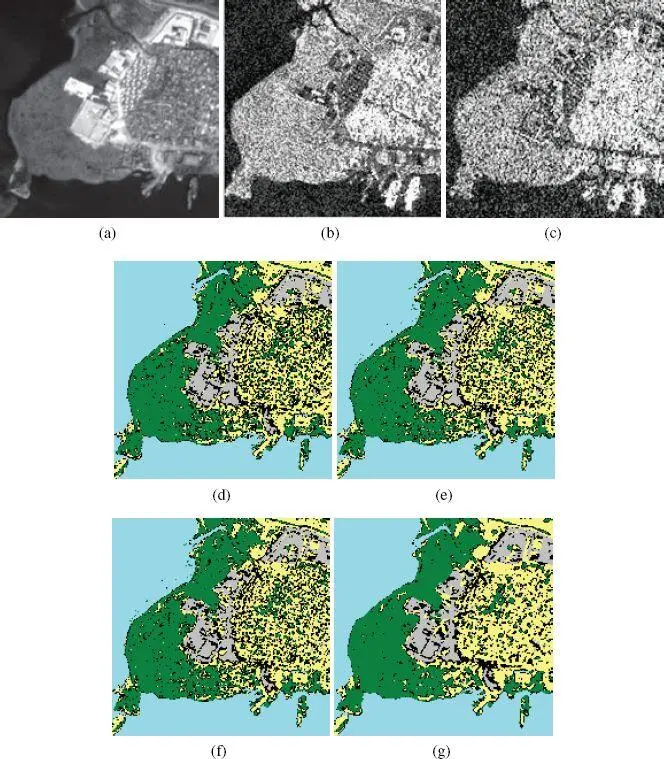
Figure 1.7. Second proposed method – first test site. (a) Pléiades (©CNES distribution Airbus DS), (b) COSMO-SkyMed (©ASI 2011) and (c) RADARSAT-2 (©CSA 2011) images of the input series. The SAR images are shown after histogram equalization. The R-band of the optical image is displayed. Classification maps obtained by operating with (d) only Pléiades data, (e) Pléiades and COSMO-SkyMed data, (f) Pléiades and RADARSAT-2 data and (g) the proposed technique with all data in the series.
Color legend: water urban vegetation bare soil containers  .
.
For a color version of this figure, see www.iste.co.uk/atto/change2.zip
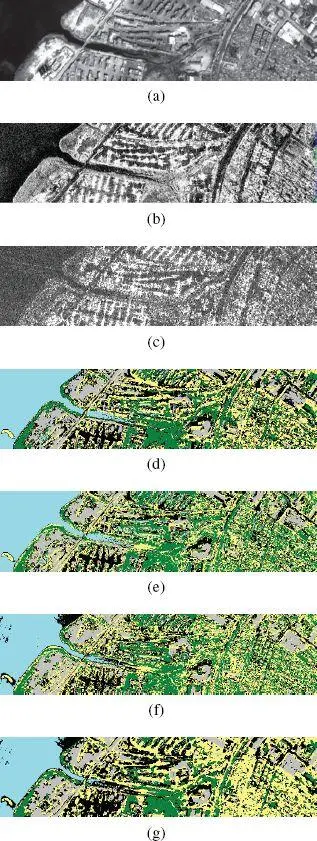
Figure 1.8. Second proposed method – second test site. (a) Pléiades (©CNES distribution Airbus DS), (b) COSMO-SkyMed (©ASI 2011) and (c) RADARSAT-2 (©CSA 2011) images of the input series. The SAR images are shown after histogram equalization. The R-band of the optical image is displayed. Classification maps obtained by operating with (d) only Pléiades data, (e) Pléiades and COSMO-SkyMed data, (f) Pléiades and RADARSAT-2 data and (g) the proposed technique with all data in the series.
Color legend: water urban vegetation bare soil containers .
For a color version of this figure, see www.iste.co.uk/atto/change2.zip
Table 1.2. Second proposed method: classification accuracies on the test set of the time series composed of Pléiades, COSMO-SkyMed (CS) and RADARSAT-2 (RS) images
| Class-wise accuracies | Overall accuracy | |||||
| Water | Urban | Vegetation | Bare soil | Containers | ||
| Pléiades only | 100% | 61.66% | 81.69% | 82.82% | 56.72% | 76.57% |
| Pléiades and CS | 100% | 44.32% | 83.54% | 74.75% | 49.12% | 70.34% |
| Pléiades and RS | 92.56% | 44.85% | 79.85% | 78.62% | 42.15% | 67.60% |
| Proposed method | 90.79% | 91.45% | 82.59% | 81.02% | 54.85% | 80.14% |
In order to explore the capability of the technique to benefit from the synergy of the VNIR optical, X-band radar and C-band radar imagery in the input series in more detail, the aforementioned results were compared to those achieved when (i) only the Pléiades data were used for classification or (ii) the Pléiades data were used in conjunction with only one of the two SAR images (see Table 1.2 and Figures 1.7 and 1.8(d)–(f)). In all such cases, the same classification scheme based on quad-trees, MPM and FMM, as in the proposed method, was applied. We omit the results obtained when only the two SAR images in the series were used because they corresponded to low accuracy values – an expected result in the case of the classification of the aforementioned classes solely with a short series of two SAR images.
The results in Table 1.2 confirm that jointly exploiting all three satellite data sources made it possible to remarkably achieve higher accuracies than when only a subset of these sources was used. When only the Pléiades image was employed, the “water”, “vegetation” and “bare soil” classes were discriminated quite accurately but the “urban” class was not. When the second proposed method was applied to these VNIR data, together with both the COSMO-SkyMed and the RADARSAT-2 data, the enhancement in the discrimination of the “urban” class was approximately +30%. Furthermore, in this case, the results were more accurate than those generated by jointly using the Pléiades image along with only one of the two SAR images in the series. This scenario suggests the capability of the second proposed method to benefit from a multimission time series, including multifrequency and multiresolution imagery from current satellite instruments at very high spatial resolution. A drawback in the results of the proposed algorithm was the lower accuracy for the “water” class, compared to when only the Pléiades data or Pléiades and COSMO-SkyMed imagery were employed. The “water” class exhibits a significant texture in the RADARSAT-2 image (see Figure 1.7(c)), and the proposed algorithm does not involve any texture analysis component. The impact of this issue is limited, as the “water” class is discriminated by the proposed algorithm with an accuracy of around 91%. However, extending the method by integrating texture extraction appears to be a promising possible generalization.
Читать дальшеИнтервал:
Закладка:
Похожие книги на «Change Detection and Image Time Series Analysis 2»
Представляем Вашему вниманию похожие книги на «Change Detection and Image Time Series Analysis 2» списком для выбора. Мы отобрали схожую по названию и смыслу литературу в надежде предоставить читателям больше вариантов отыскать новые, интересные, ещё непрочитанные произведения.


Обсуждение, отзывы о книге «Change Detection and Image Time Series Analysis 2» и просто собственные мнения читателей. Оставьте ваши комментарии, напишите, что Вы думаете о произведении, его смысле или главных героях. Укажите что конкретно понравилось, а что нет, и почему Вы так считаете.