Change Detection and Image Time Series Analysis 2
Здесь есть возможность читать онлайн «Change Detection and Image Time Series Analysis 2» — ознакомительный отрывок электронной книги совершенно бесплатно, а после прочтения отрывка купить полную версию. В некоторых случаях можно слушать аудио, скачать через торрент в формате fb2 и присутствует краткое содержание. Жанр: unrecognised, на английском языке. Описание произведения, (предисловие) а так же отзывы посетителей доступны на портале библиотеки ЛибКат.
- Название:Change Detection and Image Time Series Analysis 2
- Автор:
- Жанр:
- Год:неизвестен
- ISBN:нет данных
- Рейтинг книги:4 / 5. Голосов: 1
-
Избранное:Добавить в избранное
- Отзывы:
-
Ваша оценка:
Change Detection and Image Time Series Analysis 2: краткое содержание, описание и аннотация
Предлагаем к чтению аннотацию, описание, краткое содержание или предисловие (зависит от того, что написал сам автор книги «Change Detection and Image Time Series Analysis 2»). Если вы не нашли необходимую информацию о книге — напишите в комментариях, мы постараемся отыскать её.
Change Detection and Image Time Series Analysis 2 — читать онлайн ознакомительный отрывок
Ниже представлен текст книги, разбитый по страницам. Система сохранения места последней прочитанной страницы, позволяет с удобством читать онлайн бесплатно книгу «Change Detection and Image Time Series Analysis 2», без необходимости каждый раз заново искать на чём Вы остановились. Поставьте закладку, и сможете в любой момент перейти на страницу, на которой закончили чтение.
Интервал:
Закладка:
To experimentally validate the first method, a time series of two high-resolution images acquired in 2010 over Port-au-Prince, Haiti, has been used. The series was made of an HH-polarized single-look COSMO-SkyMed stripmap image with a 2.5 m pixel spacing (325 × 400 pixels; see Figure 1.6(a)) and of a GeoEye-1 image with a 2.5 m spatial resolution (see Figure 1.6(b)) and three channels in the visible wavelength range. The time lag between the two acquisitions was a few days. Five main land cover classes were present in the scene: urban, water, vegetation, soil and containers. These classes were defined by an expert photointerpreter who also annotated their training and test samples.
In the approach taken by the first proposed method, the quad-trees are ordered, and consistently with the cascade approach, the output classification map is the result obtained on the leaves of the second quad-tree. Here, the GeoEye-1 and COSMO-SkyMed images were associated with the first and second quad-trees, respectively. The rationale of this choice is to initialize the land cover mapping result using the optical data and to finalize it through the fusion with SAR imagery. In the case of both quad-trees, to fill in the empty levels of the quad-tree, 2D Daubechies wavelets of order 10 were applied (Mallat 2008).
The classification result obtained by the proposed technique (see Figure 1.6(g)) was compared to those generated by several previous approaches to multisensor and/or multiresolution classification. First, to compare with the result of a multiscale but single-sensor approach, the hierarchical MRF on a single quad-tree of Laferté et al. (2000) was applied to classify the image collected by each sensor. In this case, the MPM criterion was also used and the class-conditional pdfs were estimated using SEM together with multivariate Gaussian or generalized Gamma mixtures in the case of optical and SAR data, respectively (see Figure 1.6(c) and (d)). Then, to compare with a multisensor multiscale approach, the algorithm in Voisin et al. (2014) was used. It makes use of a hierarchical MRF on a single quad-tree, whose layers are filled in with both optical and SAR data in a stacked vector fashion. Multisensor fusion is accomplished using multivariate copula functions (see Figure 1.6(e)). Finally, to compare with a multisensor but single-scale approach, the technique in Storvik et al. (2009) was considered after upsampling all of the data to the pixel lattice at the finest resolution. In Storvik et al. (2009), the joint class-conditional distributions of multisensor data are estimated using meta-Gaussian density functions (essentially equivalent to Gaussian copulas) and the maximum likelihood decision rule is applied to generate the output classification map (see Figure 1.6(f)).
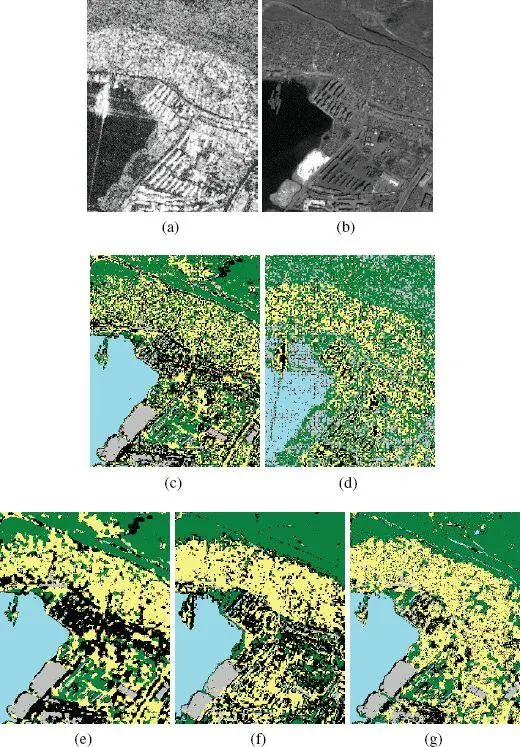
Figure 1.6. First proposed method. (a) COSMO-SkyMed (©ASI 2010) and (b) GeoEye-1 (©GeoEye 2010) images of the input series. The former is shown after histogram equalization. The R-band of the latter is displayed. Classification maps obtained by separately classifying (c) the GeoEye-1 and (d) the COSMO-SkyMed images through a hierarchical MRF on a single quad-tree. Classification maps generated by (e) the multisensor multiscale method in (Voisin et al . 2014), (f) the multisensor single-scale technique in (Storvik et al . 2009) and (g) the proposed algorithm.
Color legend: water urban vegetation bare soil containers  .
.
For a color version of this figure, see www.iste.co.uk/atto/change2.zip
First, a visual qualitative inspection of the classification maps generated by the proposed and benchmark techniques suggests that the first proposed algorithm yielded quite accurate results and obtained improvements, compared to the previous methods, especially in the separate multiscale classification of the individual images coming from COSMO-Skymed and GeoEye-1. Specifically, in the results achieved through the use of only the SAR image, roads were discriminated quite accurately, but most other classes were not. In the results obtained through the use of only the optical image, classes that were spatially homogeneous were discriminated more effectively. The proposed technique is able to benefit from both satellite data sources in order to produce a classification output in which most classes in the high-resolution data set are visually well detected. Furthermore, compared to the case of multisensor but single-scale classification through the algorithm described in Storvik et al . (2009), the proposed method improved in terms of the spatial regularity of the classification map. This result is interpreted as a consequence of the contextual modeling components that are integrated in the proposed approach and are due to MRF modeling over a quad-tree and wavelet transformation.
Table 1.1. First proposed method: classification accuracies and computation times of the proposed technique and of the previous algorithms in Storvik et al . (2009) and Voisin et al . (2014) on the test set of the time series composed of COSMO-SkyMed and GeoEye-1 images. Computation times refer to an Intel i7 quad-core, 2.40 GHz, 8-GB RAM, 64-bit Linux system
| Class-wise accuracies | Overall accuracy | Time [s] | |||||
| Water | Urban | Vegetation | Bare soil | Containers | |||
| Proposed method | 100% | 78.12% | 89.46% | 98.78% | 47.12% | 82.69% | 254 |
| (Storvik et al. 2009) | 99.95% | 97.32% | 90.81% | 96.22% | 37.25% | 79.44% | 298 |
| (Voisin et al. 2014) | 100% | 75.24% | 87.16% | 98.89% | 49.31% | 82.12% | 668 |
The effectiveness of the results of the proposed technique and the improvement, compared to those achieved by the algorithm in Storvik et al. (2009), are quantitatively confirmed by the classification accuracies on the test samples of the aforementioned classes (see Table 1.1). All considered methods obtained a poor discrimination of the “containers” class, due to its significant overlapping with the “urban” class in the multisensor or multispectral feature space. As a further evolution of the present technique, improvements in the discrimination of this class could be obtained by using texture features. On the one hand, accurate performance on the test samples, quite similar to those achieved by the proposed method, was also obtained by the multisensor multiscale technique in Voisin et al . (2014). On the other hand, the proposed algorithm granted improvements over this benchmark approach with regard to the spatial detail in the resulting maps (see Figure 1.6 (e) and (g)) and to the overall computational burden (see Table 1.1). The latter advantage is due to the fact that addressing multisensor fusion using multiple quad-trees in cascade can leverage on the time efficiency of the sequential recursive formulation of MPM, without requiring the challenging and possibly time-expensive problem of the modeling of the joint pdf of optical and SAR data. On the contrary, this problem is involved in the approaches in Storvik et al. (2009) and Voisin et al. (2014), in which copulas and meta-Gaussian densities are used for this purpose.
Читать дальшеИнтервал:
Закладка:
Похожие книги на «Change Detection and Image Time Series Analysis 2»
Представляем Вашему вниманию похожие книги на «Change Detection and Image Time Series Analysis 2» списком для выбора. Мы отобрали схожую по названию и смыслу литературу в надежде предоставить читателям больше вариантов отыскать новые, интересные, ещё непрочитанные произведения.


Обсуждение, отзывы о книге «Change Detection and Image Time Series Analysis 2» и просто собственные мнения читателей. Оставьте ваши комментарии, напишите, что Вы думаете о произведении, его смысле или главных героях. Укажите что конкретно понравилось, а что нет, и почему Вы так считаете.