Reservoir Characterization
Здесь есть возможность читать онлайн «Reservoir Characterization» — ознакомительный отрывок электронной книги совершенно бесплатно, а после прочтения отрывка купить полную версию. В некоторых случаях можно слушать аудио, скачать через торрент в формате fb2 и присутствует краткое содержание. Жанр: unrecognised, на английском языке. Описание произведения, (предисловие) а так же отзывы посетителей доступны на портале библиотеки ЛибКат.

- Название:Reservoir Characterization
- Автор:
- Жанр:
- Год:неизвестен
- ISBN:нет данных
- Рейтинг книги:3 / 5. Голосов: 1
-
Избранное:Добавить в избранное
- Отзывы:
-
Ваша оценка:
Reservoir Characterization: краткое содержание, описание и аннотация
Предлагаем к чтению аннотацию, описание, краткое содержание или предисловие (зависит от того, что написал сам автор книги «Reservoir Characterization»). Если вы не нашли необходимую информацию о книге — напишите в комментариях, мы постараемся отыскать её.
This collection of papers covers the strategic and economic implications of methods used to characterize petroleum reservoirs. Born out of the journal by the same name, formerly published by Scrivener Publishing, most of the articles in this volume have been updated, and there are some new additions, as well, to keep the engineer abreast of any updates and new methods in the industry.
Truly a snapshot of the state-of-the-art, this groundbreaking volume is a must-have for any petroleum engineer working in the field, environmental engineers, petroleum engineering students, and any other engineer or scientist working with reservoirs.
Reservoir Characterization — читать онлайн ознакомительный отрывок
Ниже представлен текст книги, разбитый по страницам. Система сохранения места последней прочитанной страницы, позволяет с удобством читать онлайн бесплатно книгу «Reservoir Characterization», без необходимости каждый раз заново искать на чём Вы остановились. Поставьте закладку, и сможете в любой момент перейти на страницу, на которой закончили чтение.
Интервал:
Закладка:
(2.2) 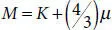
The usual process is initiated by replacing the primary fluid with a fluid with similar sets of velocities and rock densities, compared with the primary fluid. These velocities are usually obtained from logs, but sometimes they may also be the results of theoretical models. In this study, the velocity of the wave that has passed through the primary fluid (in our case, supercritical dioxide is injected into the water) is obtained through laboratory measurements. But the removal of the existing fluid effects and replacing it by the common fluid (brine) has been achieved through the following steps (Dvorkin, 2003):
In the first stage the effective bulk modulus of pore fluid composition, (  ) is calculated using:
(2.3) 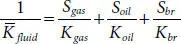
where, Sgas , Soil , Sbr , indicate gas, oil and brine saturation and Kgas , Koil , Kbr , correspond to the apparent modulus of gas, oil, and brine. In the next step, bulk modulus of rock ( K log), is calculated by equation (2.4):
(2.4) 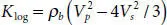
where, ρb is the bulk density and Vp is the compressional wave velocity of the rock. At the next step, bulk modulus of dry rock ( K dry) is calculated using the equation (2.5)and the mineral bulk modulus:
(2.5) 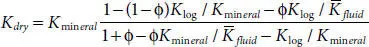
where, ϕ is porosity and Kmineral is the apparent modulus in the mineral phase (Thomsen, 1986). The bulk modulus of rock saturated with brine ( Kcommon ) is determined by:
(2.6) 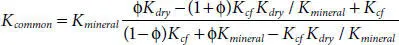
where, Kcf is the bulk modulus. The compressional wave modulus of the rock saturated with brine ( Mcommon ) is calculated using the following formula:
(2.7) 
The compressional wave velocity after removal of the primary fluid and replacing it with brine is obtained by:
(2.8) 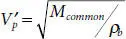
In this case, when the shear wave data is not available, compressional wave modulus ( M log) is calculated from charts (logs) using the following relation:
(2.9) 
The compressional wave modulus of the dry rock ( Mdry ) is also calculated using compressional wave modulus of the rock’s minerals:
(2.10) 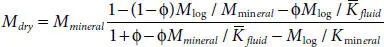
(2.11) 
where, ϕ is porosity, μmineral is shear modulus and Kmineral is the apparent modulus in the mineral phase. The changes in the elastic modules of different minerals as a whole have been estimated [28]. Finally, the compressional wave modulus of the brine saturated rock ( Mcommon ) is calculated as follows:
(2.12) 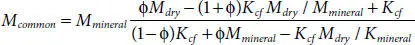
Greenberg - Castagna formula is defined for rocks completely saturated with brine. In this paper, the apparent modulus ( Kcf ) of 2/25 is assumed for brine saturated cases.
It is worth mentioning that the fluid changes have no effect on shear wave modulus, which is the same before and after complete saturation with brine.
2.2.2 Estimating Geomechanical Parameters
Here to determine the bulk modulus, shear modulus, and Young’s modulus of rocks, we assumed that they are elastic, homogeneous and isotropic and used the following formula:
(2.13) 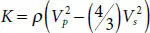
(2.14) 
(2.15) 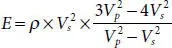
2.3 Laboratory Set Up and Measurements
The data used in this study were collected by a core flooding system at the laboratory of petroleum engineering department, Curtin University of Technology, Australia. The tested sandstone sample has the volume of 2.350 (gr/cm 3), 3.79 cm in diameter, 7.98 cm in length and the porosity of 36/43 deg. After drying and preliminary preparation of this sample, it was placed in a polymer sleeve to be protected from the fluid axial pressure applied. The sample was placed inside the core holder, and piezoelectric (transducers) were placed on the caps to send and receive the acoustic wave. Figure 2.2shows schematically, how the sample and exposure transducer were placed.
As seen in Figure 2.2, the enclosed sample is under P rpressure (radial pressure) and axial pressure, P ax, is applied. In these conditions, the pore pressure is shown as Pp. In Figure 2.2, OD represents the outside diameter of the cap, ID represents the inside diameter of the cap, r is the core radius and P axialis effective axial pressure that is calculated as in equation (2.16):
(2.16) 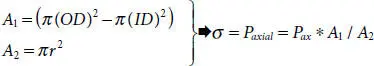
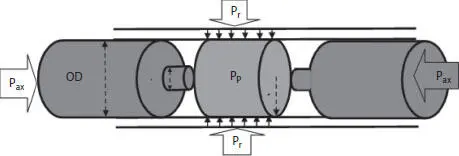
Figure 2.2 The placement of the test device is shown in schemati.
Different parts of this chamber which is in direct contact with the fluid, are neutral to chemical reaction. At the ends of this chamber, two caps are placed were the transducers have been installed. As seen in Figure 2.3, the receiver and transmitter are in direct contact with the sample.
The laboratory system is equipped with a back pressure regulator (BPR), to make it possible to simulate the behavior of real reservoir pressure. For axial and confining pressures, a hand pump has been used, and to achieve pore pressure, a hydraulic pump has been utilized. This test has been performed at room temperature. Signals are stored in a computer equipped with particular software which has the capability to integrate into the oscilloscope. Shown in Figure 2.4ais the complete flooding system device with three different fluid injection capsule, each with different kinds of fluids and the oven chamber that maintains the desired test temperature (46 °C in this experiment). Figure 2.4bindicates a picture of the core holder and connected transducers.
Читать дальшеИнтервал:
Закладка:
Похожие книги на «Reservoir Characterization»
Представляем Вашему вниманию похожие книги на «Reservoir Characterization» списком для выбора. Мы отобрали схожую по названию и смыслу литературу в надежде предоставить читателям больше вариантов отыскать новые, интересные, ещё непрочитанные произведения.


Обсуждение, отзывы о книге «Reservoir Characterization» и просто собственные мнения читателей. Оставьте ваши комментарии, напишите, что Вы думаете о произведении, его смысле или главных героях. Укажите что конкретно понравилось, а что нет, и почему Вы так считаете.