Geophysical Monitoring for Geologic Carbon Storage
Здесь есть возможность читать онлайн «Geophysical Monitoring for Geologic Carbon Storage» — ознакомительный отрывок электронной книги совершенно бесплатно, а после прочтения отрывка купить полную версию. В некоторых случаях можно слушать аудио, скачать через торрент в формате fb2 и присутствует краткое содержание. Жанр: unrecognised, на английском языке. Описание произведения, (предисловие) а так же отзывы посетителей доступны на портале библиотеки ЛибКат.

- Название:Geophysical Monitoring for Geologic Carbon Storage
- Автор:
- Жанр:
- Год:неизвестен
- ISBN:нет данных
- Рейтинг книги:4 / 5. Голосов: 1
-
Избранное:Добавить в избранное
- Отзывы:
-
Ваша оценка:
Geophysical Monitoring for Geologic Carbon Storage: краткое содержание, описание и аннотация
Предлагаем к чтению аннотацию, описание, краткое содержание или предисловие (зависит от того, что написал сам автор книги «Geophysical Monitoring for Geologic Carbon Storage»). Если вы не нашли необходимую информацию о книге — напишите в комментариях, мы постараемся отыскать её.
Geophysical Monitoring for Geologic Carbon Storage
Volume highlights include: Geophysical Monitoring for Geologic Carbon Storage
The American Geophysical Union promotes discovery in Earth and space science for the benefit of humanity. Its publications disseminate scientific knowledge and provide resources for researchers, students, and professionals.
Geophysical Monitoring for Geologic Carbon Storage — читать онлайн ознакомительный отрывок
Ниже представлен текст книги, разбитый по страницам. Система сохранения места последней прочитанной страницы, позволяет с удобством читать онлайн бесплатно книгу «Geophysical Monitoring for Geologic Carbon Storage», без необходимости каждый раз заново искать на чём Вы остановились. Поставьте закладку, и сможете в любой момент перейти на страницу, на которой закончили чтение.
Интервал:
Закладка:
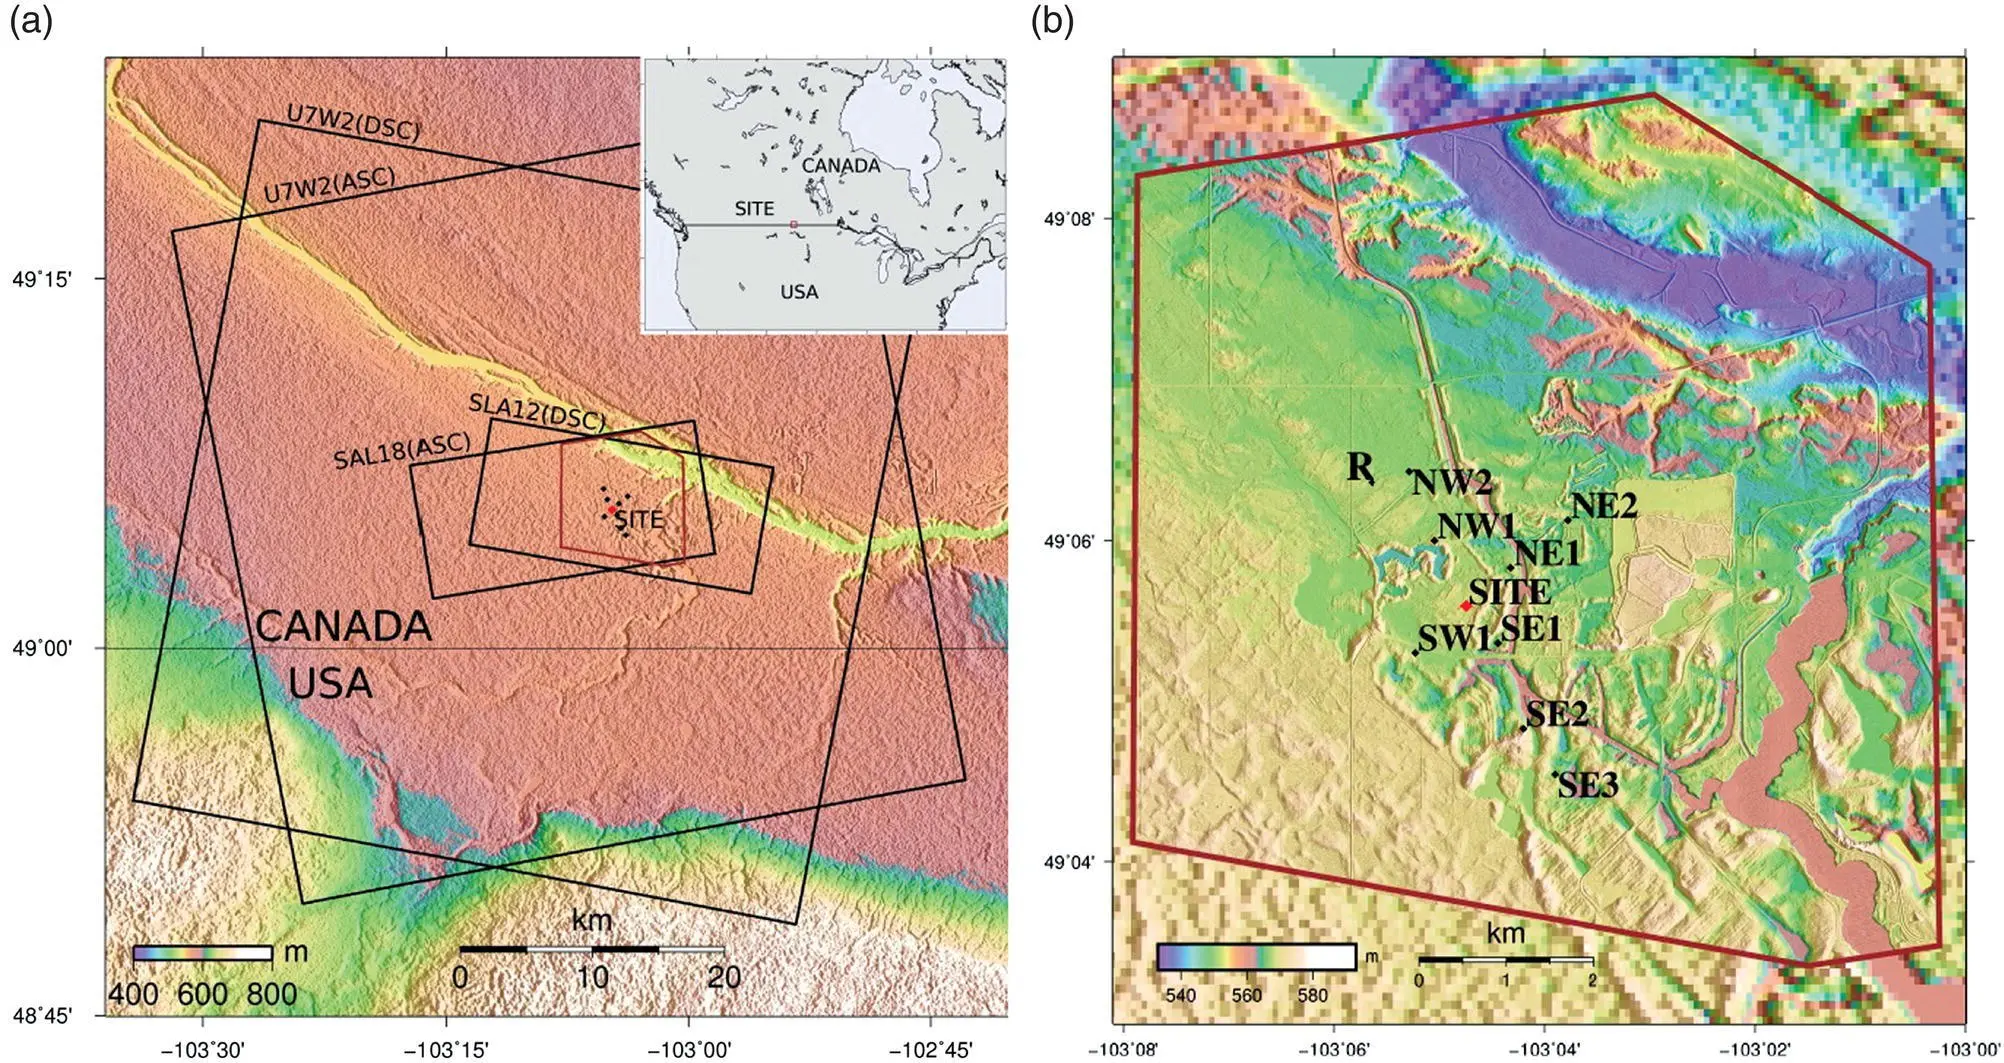
Figure 2.9 (a) Location of the Aquistore storage site in Saskatchewan, Canada. Advanced Spaceborne Thermal Emission and Reflection Radiometer (ASTER) 30 m resolution Digital Elevation Model (DEM). The RADARSAT‐2 InSAR data frames are outlined in black. The region of interest is outlined in brown. Extent in top‐right corner shows location of study region in North America. (b) LIDAR 1 m resolution DEM plotted over ASTER DEM. The reference region “R” is assumed to be stable. The monitoring sites NE1, NE2, SE1, SE2, SE3, SITE, SW1, NW1, NW2 are plotted in black.
The SAR data are converted to individual interferograms, geocoded, and resampled to a common grid and then processed with the advanced Multidimensional Small Baseline (MSBAS) processor (Samsonov & d'Oreye, 2012). The MSBAS technique estimates two‐dimensional (vertical and east‐west) deformation time series, relative to a stable reference point, labeled R in Figures 2.9and 2.10, by combing SAR data from various sensors and acquisition geometries. To further improve the precision of deformation measurements, especially during the winter months when the ground is covered by snow, a network of corner reflectors was installed with reflectors at nine monitoring sites marked in Figures 2.9and 2.10. The corner reflectors were designed at the Canada Centre for Mapping and Earth Observation, Natural Resources Canada. They consist of two trihedral reflectors positioned for ascending and descending imaging geometry ( Fig. 2.10) and mounted on a single monument. In order to more accurately capture ground deformation from a deep source (i.e., CO 2injection) and to reduce signals from the near surface processes caused by seasonal changes and postmining soil settlement, the corner reflector monuments were anchored at a depth of 20 m.
RADARSAT‐2 SAR data have been collected since June 2012, well before the start of injection in April 2015. The roughly three years of preinjection observations allowed for the determination of background surface deformation due to a variety of sources. The vertical and east‐west horizontal deformation maps are shown in Figure 2.11. During the 2012 – 2014 period, active ground deformation processes were observed across the region. Subsidence, exceeding 0.8 cm/year, was predominantly observed in areas undergoing mining reclamation and in regions where construction activities have influenced the surface. Uplift was observed at a number of man‐made sites, but other locations are affected by groundwater recharge and swelling clays. Horizontal motions of up to 0.4 cm/year were observed, mainly along the steep slopes of the diversion canal. Analysis of the preinjection deformation reveals that some sites are affected by near‐surface deformation processes, in particular sites located south of the injection well (SW1, SE2, SE3), emphasizing the importance of adequate preinjection monitoring. In Figure 2.12, we plot the displacement components associated with point P2 in Figure 2.11, a point close to the injection site that experienced some fast ground deformation.
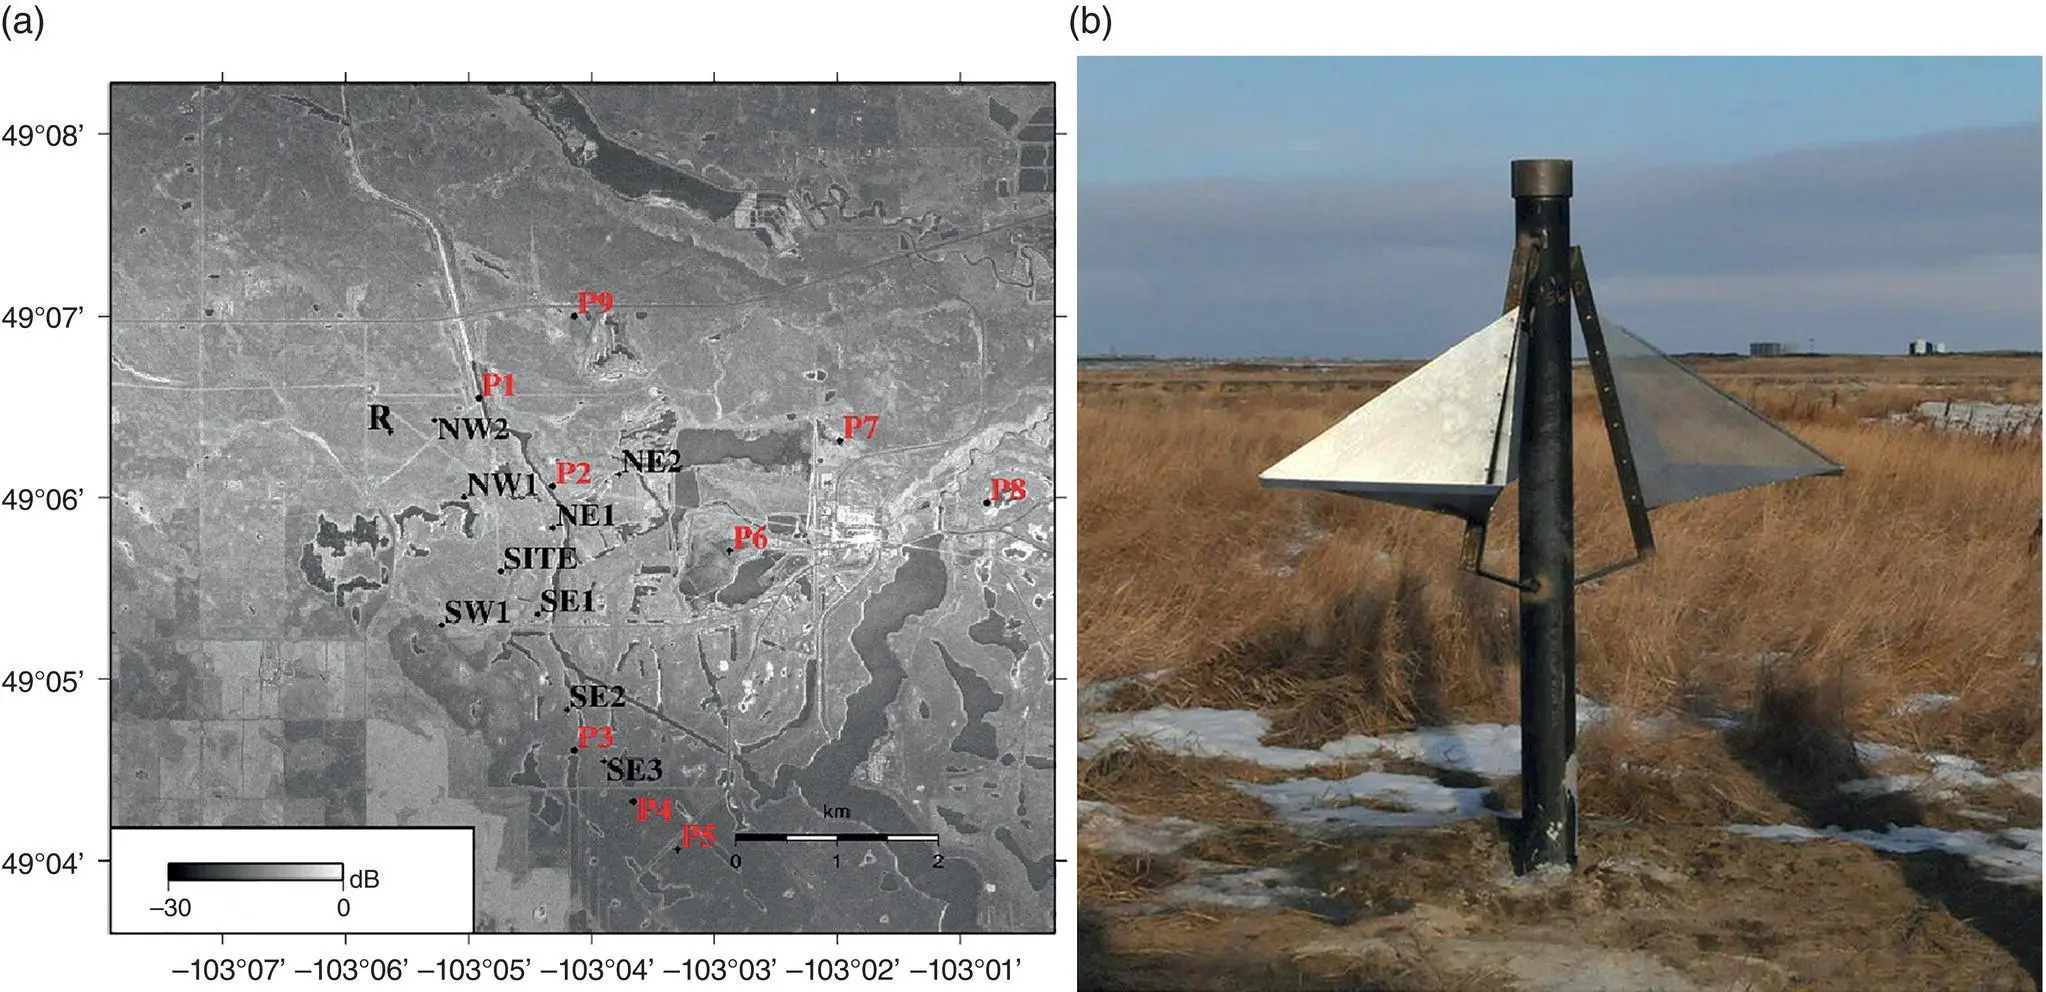
Figure 2.10 (a) RADARSAT‐2 Spotlight 12 SAR intensity image acquired on 23 August 2014. Monitoring sites and stable reference region “R” are plotted in black. Points P1–P9 experiencing fast ground deformation are plotted in red
(RADARSAT‐2 Data and Products © MDA Geospatial Services Inc., 2014. All Rights Reserved. RADARSAT is an official mark of the Canadian Space Agency).
(b) Photograph of corner reflector designed at the Canada Centre for Mapping and Earth Observation, Natural Resources Canada by K. Murnaghan for ascending and descending imaging.
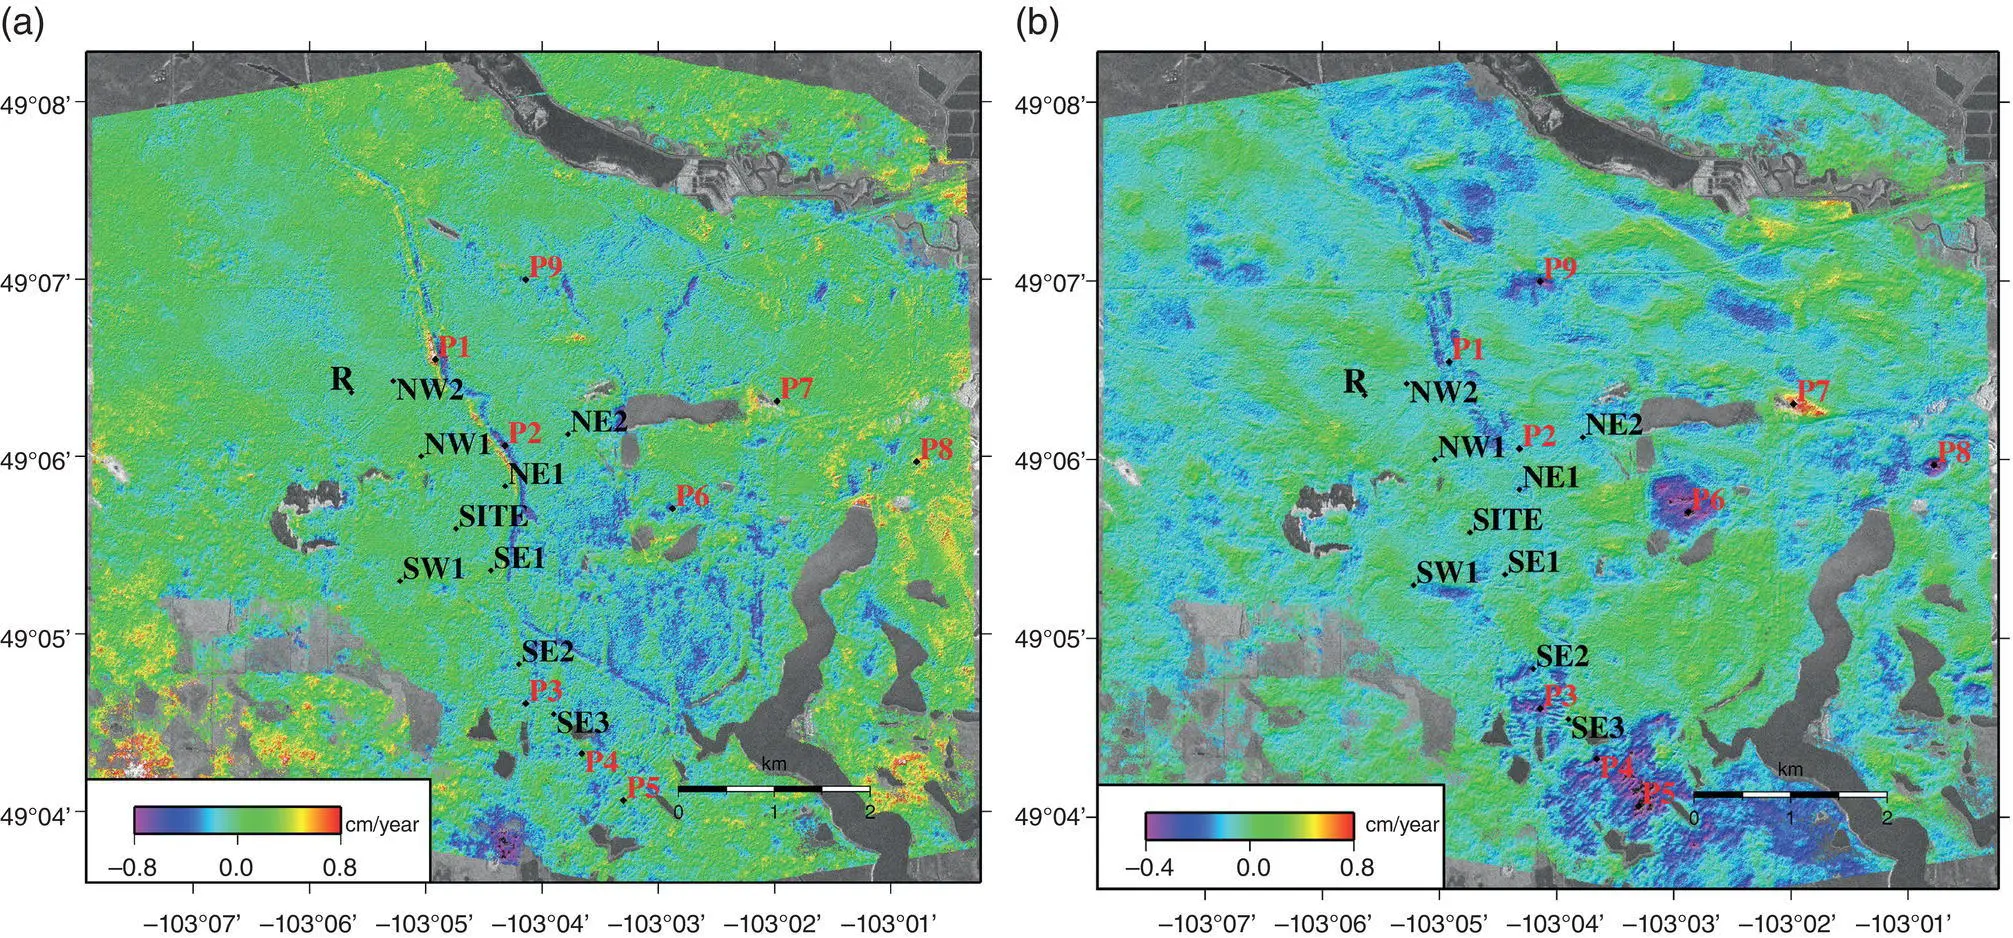
Figure 2.11 Observed (a) vertical and (b) east‐west horizontal deformation rates computed by applying Multidimensional Small Baseline (MSBAS) technique to RADARSAT‐2 data spanning a time interval, 15 June 2012 to 23 September 2014, prior to the start of injection. Monitoring sites and reference region “R” are plotted in black. Points P1–P9 experiencing fast ground deformation are plotted in red. SAR intensity image is exposed in background in regions of low coherence.
Elastic and poroelastic modeling were performed to simulate the ground deformation that would be caused by CO 2injection rates of 1,500 tonnes/day (i.e., the maximum expected rate) at a depth of 3,150 – 3,350 m (Samsonov et al., 2015). Elastic modeling with a point source model (Mogi, 1958) suggests a constant annual uplift rate of about 1.6 cm/year and east‐west motion of up to 0.6 cm/year. However, poroelastic modeling suggests that uplift will reach its maximum value of about 1.6 cm near the injection site almost immediately after the start of injection but its spatial extent will continue to increase during the entire modeled injection period of 25 yr. Horizontal motion calculated by the poroelastic model does not exceed 0.1 cm but forms a very broad pattern, extending 40 km from the injection well. The poroelastic model better represents the constitutive properties of the fluid‐filled porous rocks and the nature of the injection process, and is considered to be more realistic than the elastic model. Comparison of the poroelastic model predictions of ground deformation with the measurement precision (95% confidence interval) of the deformation maps, which does not exceed 0.3 and 0.2 cm/year, suggests that only the vertical motion will be detectable.
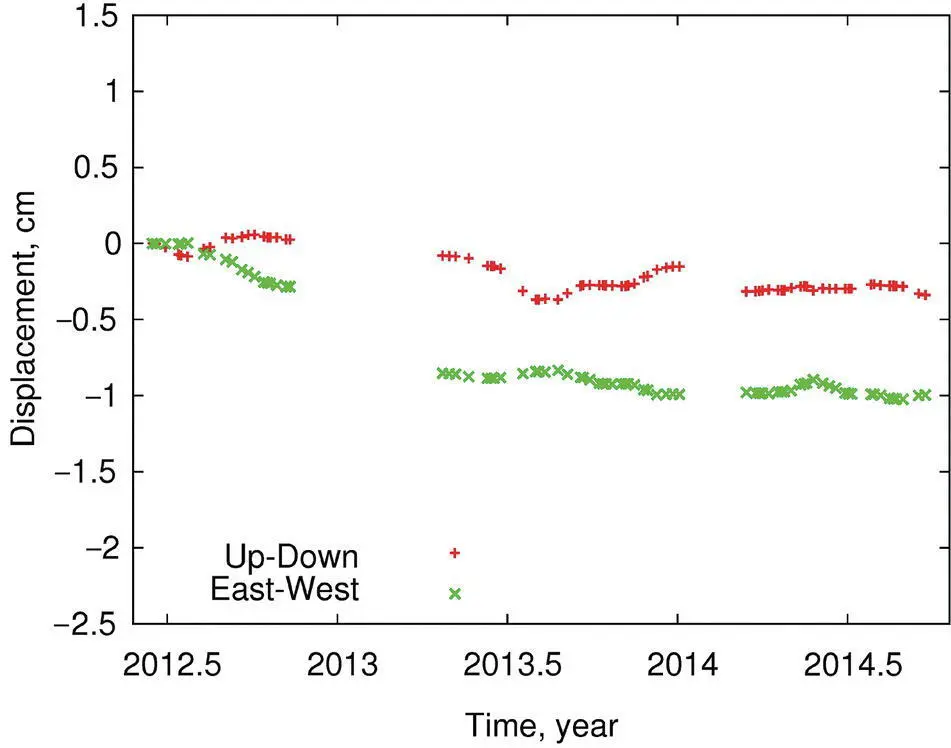
Figure 2.12 Two components of displacement associated with point P2 from Figure 2.10. This location is not far from the injection site and has experienced some deformation prior to injection.
2.4.3. Illinois Basin Decatur Project, USA
The Illinois Basin Decatur Project, started in November 2011, is a multiyear program managed by Archer Daniels Midland, the U. S. Department of Energy, the Illinois State Geological Survey, and Schlumberger Carbon Services. This is the only carbon capture and storage effort in the United States that is currently injecting large volumes of greenhouse gas emissions into a regional deep saline formation (Finley et al., 2011, 2013). The injection, from an ethanol production facility, started at a rate of 1,000 metric tons/day and is planned to increase to over 2,000 metric tons/day. The super‐critical CO 2is stored in the 550 m thick Mount Simon sandstone at a depth of 2.1 km. The overlying Eau Claire shale forms a 100 – 150 m thick seal. The Mount Simon formation was the site of a functioning natural gas storage facility and has performed well in that capability. Several different geochemical, geophysical, and remote sensing technologies are employed at the site to monitor the evolution of the injected volume of carbon dioxide. Preliminary results from microseismic and InSAR monitoring have been reported by Kaven et al. (2014) and Falorni et al. (2014), respectively.
The injection site is situated in a mixture of industrial sites, farmland, forest, and residential areas and InSAR monitoring can be challenging in such a diverse environment. The SqueeSAR algorithm described in section 2.2.3, with its combination of permanent or persistent scatterers (PS) and distributed scatterers (DS), is a flexible method for treating such a wide variety of land surfaces. The distribution of the approximately 109,000 scatterers found in the region surrounding the injection well (Falorni et all 2014) is shown in Figure 2.13.
Читать дальшеИнтервал:
Закладка:
Похожие книги на «Geophysical Monitoring for Geologic Carbon Storage»
Представляем Вашему вниманию похожие книги на «Geophysical Monitoring for Geologic Carbon Storage» списком для выбора. Мы отобрали схожую по названию и смыслу литературу в надежде предоставить читателям больше вариантов отыскать новые, интересные, ещё непрочитанные произведения.


Обсуждение, отзывы о книге «Geophysical Monitoring for Geologic Carbon Storage» и просто собственные мнения читателей. Оставьте ваши комментарии, напишите, что Вы думаете о произведении, его смысле или главных героях. Укажите что конкретно понравилось, а что нет, и почему Вы так считаете.