Geophysical Monitoring for Geologic Carbon Storage
Здесь есть возможность читать онлайн «Geophysical Monitoring for Geologic Carbon Storage» — ознакомительный отрывок электронной книги совершенно бесплатно, а после прочтения отрывка купить полную версию. В некоторых случаях можно слушать аудио, скачать через торрент в формате fb2 и присутствует краткое содержание. Жанр: unrecognised, на английском языке. Описание произведения, (предисловие) а так же отзывы посетителей доступны на портале библиотеки ЛибКат.

- Название:Geophysical Monitoring for Geologic Carbon Storage
- Автор:
- Жанр:
- Год:неизвестен
- ISBN:нет данных
- Рейтинг книги:4 / 5. Голосов: 1
-
Избранное:Добавить в избранное
- Отзывы:
-
Ваша оценка:
Geophysical Monitoring for Geologic Carbon Storage: краткое содержание, описание и аннотация
Предлагаем к чтению аннотацию, описание, краткое содержание или предисловие (зависит от того, что написал сам автор книги «Geophysical Monitoring for Geologic Carbon Storage»). Если вы не нашли необходимую информацию о книге — напишите в комментариях, мы постараемся отыскать её.
Geophysical Monitoring for Geologic Carbon Storage
Volume highlights include: Geophysical Monitoring for Geologic Carbon Storage
The American Geophysical Union promotes discovery in Earth and space science for the benefit of humanity. Its publications disseminate scientific knowledge and provide resources for researchers, students, and professionals.
Geophysical Monitoring for Geologic Carbon Storage — читать онлайн ознакомительный отрывок
Ниже представлен текст книги, разбитый по страницам. Система сохранения места последней прочитанной страницы, позволяет с удобством читать онлайн бесплатно книгу «Geophysical Monitoring for Geologic Carbon Storage», без необходимости каждый раз заново искать на чём Вы остановились. Поставьте закладку, и сможете в любой момент перейти на страницу, на которой закончили чтение.
Интервал:
Закладка:
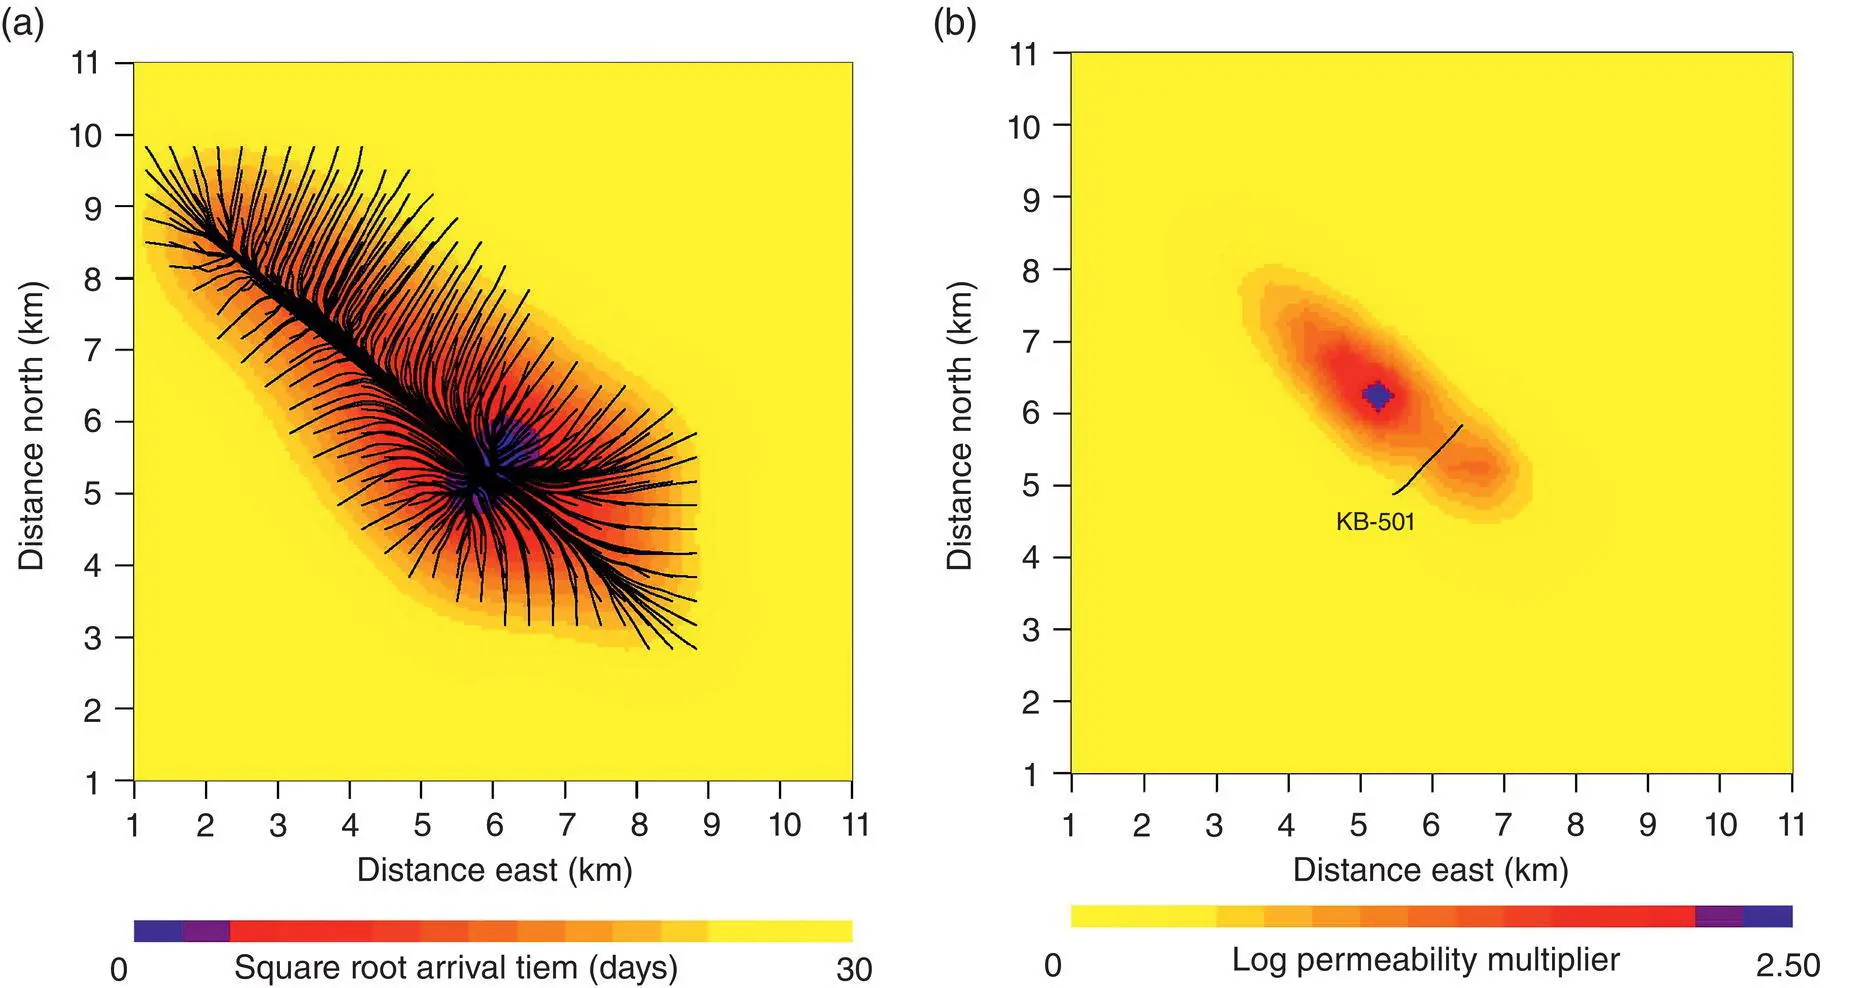
Figure 2.4 (a) Onset time of the most rapid change in reservoir volume. The curves indicate the flow paths from the well to points within the reservoir. (b) Logarithm of the permeability multiplier found by solving equation 2.20along the trajectories.
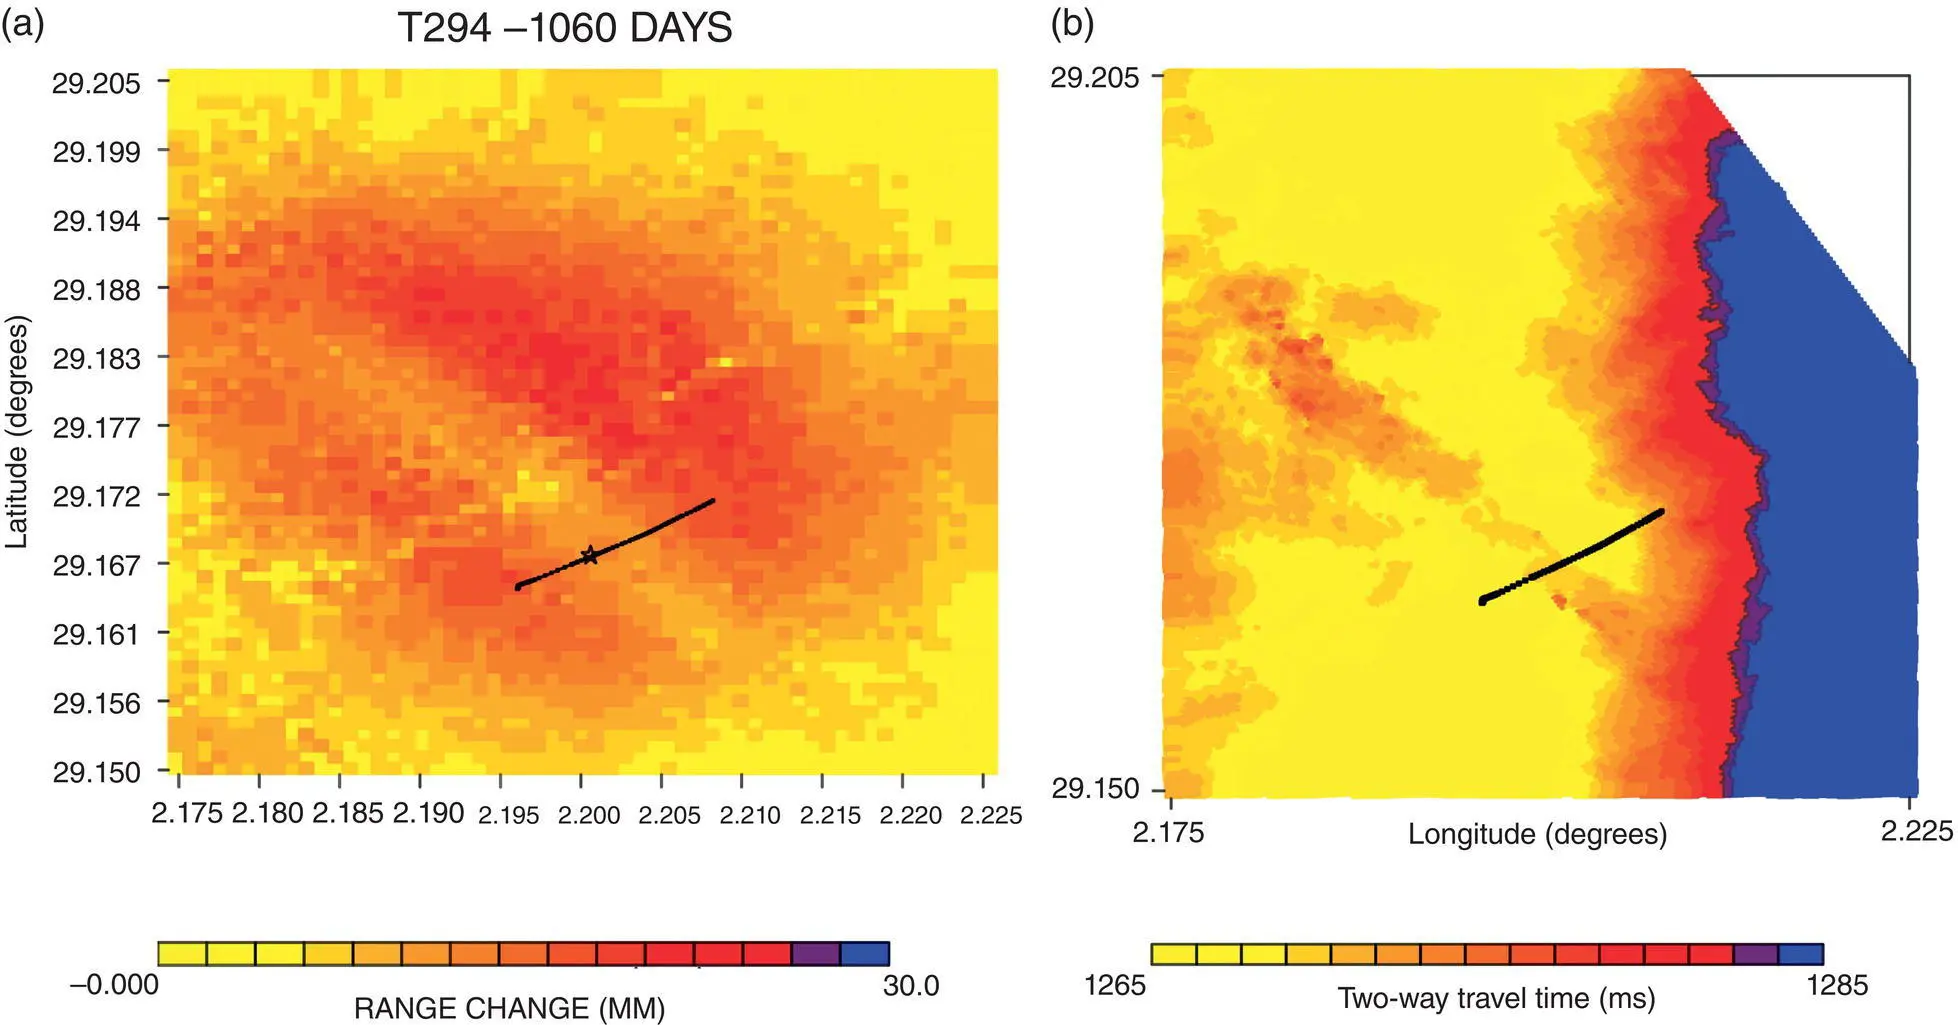
Figure 2.5 (a) Detailed view of range change above well KB‐502 following 1,060 days of injection. The darker colors signify range decrease associated with uplift above the well. (b) Seismic horizon displaying pushdown, most likely due to velocity decreases associated with the migration of injected carbon dioxide.
A homogeneous elastic model of the overburden did not produce the correct range change estimates, and hence an inversion based upon a model with uniform properties led to erroneous depth estimates for a tensile source. Thus, elastic layering, derived from well logs, had to be included in the modeling. The total range change from 12 July 2003 through 19 March 2007 was used to infer the distribution of volume change within the reservoir and the distribution of aperture change over the fault/fracture zone. It was found that the range changes could be matched by a combination of reservoir volume change and cumulative tensile opening of a fault/fracture zone confined to lie at depths within 100 m of the reservoir (Vasco et al., 2010). The lateral extent of the fracture opening was much greater, extending over 3 km from the injection point. Aspects of the fault/fracture zone were subsequently supported in an analysis of three‐dimensional surface seismic data. In particular, Gibson‐Poole and Raikes (2010) noted that time shifts, thought to be due to the injection of carbon dioxide and the resulting seismic velocity change, followed a remarkably linear zone with near parallel boundaries located between the two lobes of range change ( Fig. 2.5). The orientation of the seismic feature agreed rather well with the azimuth of 135 degrees required to fit the range‐change data. These conclusions were subsequently supported by the work of Zhang et al. (2015, 2016).
X‐Band InSAR and Multicomponent Displacement Data
The Envisat C‐band satellite was deorbited on October 2010 and was no longer available for monitoring the range changes over the injectors at In Salah. Fortunately, several other satellite systems were functional as replacements before this date. In particular, the COSMO‐SkyMed (CSK) X‐band satellite pair were launched and operational before the loss of the Envisat satellite. Similarly, the TerraSAR X‐band satellite was also put in orbit, with a repeat cycle of 11 days. Thus, three X‐band satellites were accessible for estimating range changes at the In Salah site due to the injection of carbon dioxide. The repeat time attainable for these three satellites was 8 to 11 days, much better than the best possible Envisat return time of 35 days. The down side of this transition to X‐band data was the increased cost of data acquisition because the satellites have to be tasked to gather data at a particular site. However, with the help of British Petroleum, we were able to acquire X‐band SAR scenes from both ascending and descending acquisition geometries from 2009 until 2012.
Due to the favorable geometry of the two‐satellite systems, it was possible to obtain both quasi‐east‐west and quasi‐vertical components for all time intervals during this period. An example is shown in Figure 2.6for displacements above well KB‐501. Note that there is a hint of a double‐lobed pattern in the vertical component of displacement. As at KB‐502, this pattern suggests the possible opening of a subvertical tensile feature, such as a fault or damage zone. The existence of such a damage zone is supported by the narrow, linear, high‐permeability trend shown in Figure 2.4, found by the diffusive travel time inversion of Vasco et al. (2008). Furthermore, a recent inversion of a decomposition of C‐band data into quasi‐vertical and quasi–east‐west components found that is was not possible to fit both data sets simply with reservoir volume change. A contribution from a subvertical tensile feature provided an acceptable fit to the two components (Rucci et al., 2013). Based upon these results, a steeply dipping (86 o) tensile damage‐zone model was adopted to explain the surface displacement observed in Figure 2.6. The subvertical damage zone, with an orientation of 135 o, was divided into a 20 x15 grid of surface elements. Each grid element could undergo a distinct aperture change in order to fit the two components of data. The resulting model ( Fig. 2.7) contains an elongated region of aperture change from the depth of injection to about 100 m above the well. Significant aperture change extends roughly 6 to 7 km to the northwest of the injection well and about 5 km to the southeast.
The aperture change estimates, shown in Figure 2.7, provide a reasonable fit to the InSAR observations, even reproducing the small secondary lobe at the eastern edge of the vertical displacement anomaly ( Fig. 2.8).
2.4.2. Aquistore, Canada
The Aquistore CO 2Storage Project (Worth et al., 2014) began in 2012 in southeastern Saskatchewan, Canada ( Fig. 2.9). The site serves as buffer storage for the world's first commercial, postcombustion, carbon capture plant that began operation in October 2014 at the Boundary Dam coal‐fired power station. Injection started in April 2015 with a maximum anticipated injection rate of up to 1,500 tonnes/day. The carbon dioxide is sequestered in the brine‐filled clastic strata of the Deadwood and Winnipeg formations at 3,150 – 3,350 m depth, the deepest sedimentary units in the Williston Basin (Norford et al., 1994). Similar deep saline formations are found throughout the world. These formations are well suited for the storage of carbon dioxide because they are porous and permeable, have huge volumes, and are overlain by geologic seals that will impede the upward migration of CO 2.
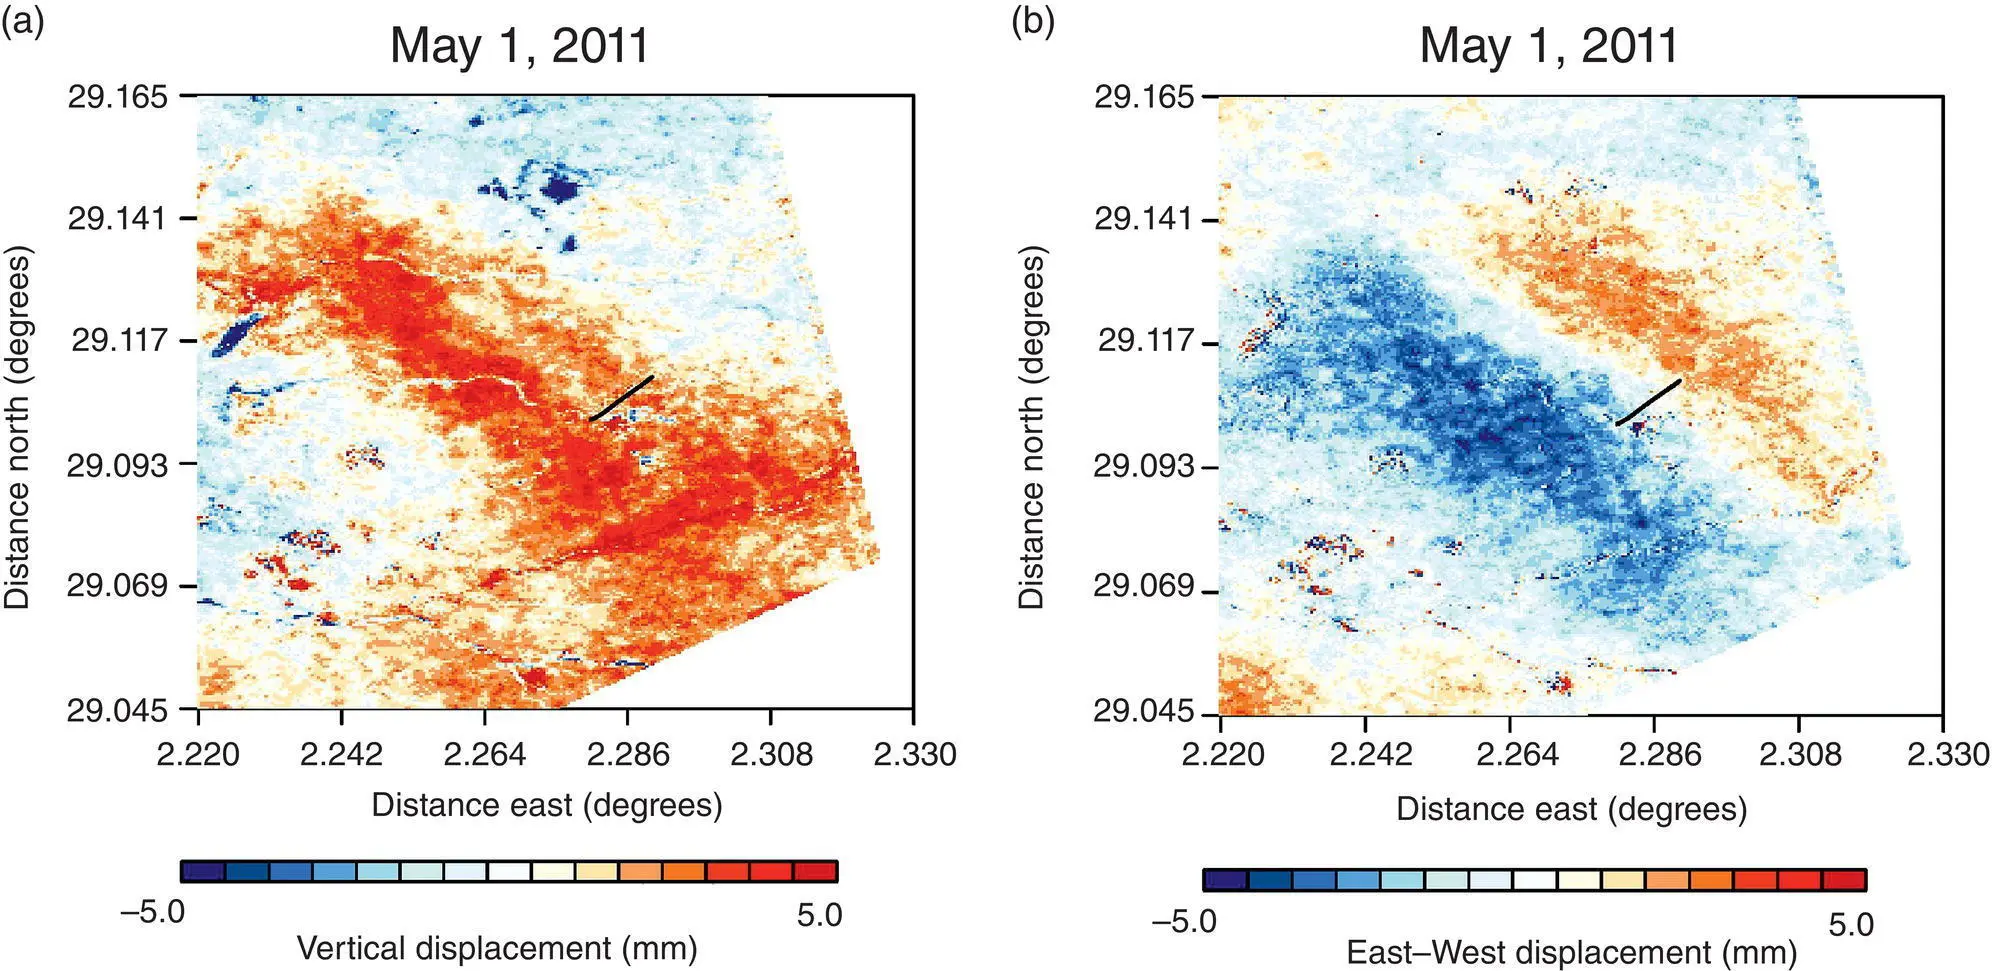
Figure 2.6 (a) Vertical displacements above well KB‐501, derived from X‐band InSAR data. (b) East‐west displacements above the injection well KB‐501.
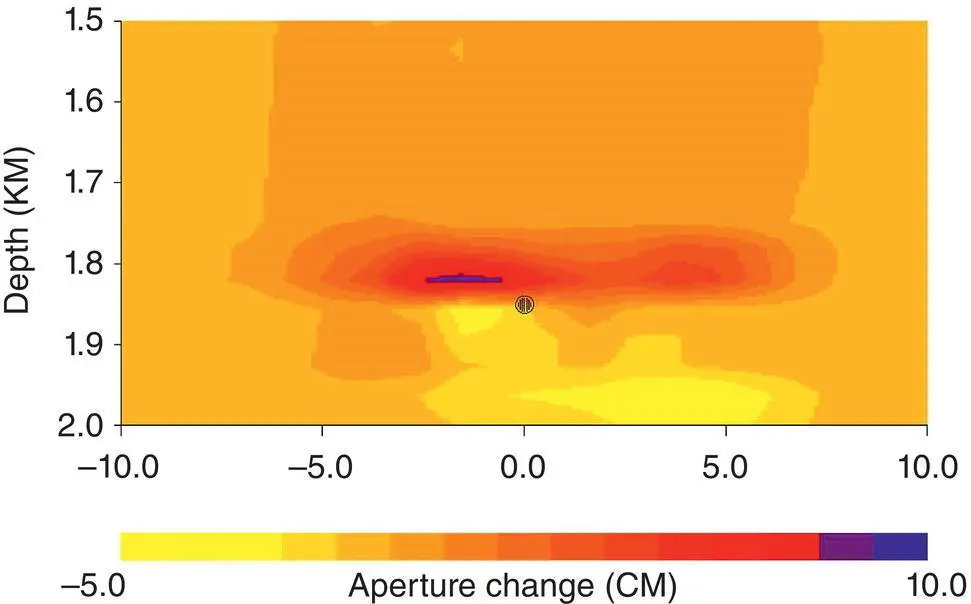
Figure 2.7 Distribution of total aperture change (effective fracture zone opening) on a dipping damage zone, produced by an inversion of the two components of displacement shown in Figure 2.6. The black dot denotes the intersection point of the horizontal well with the damage zone.
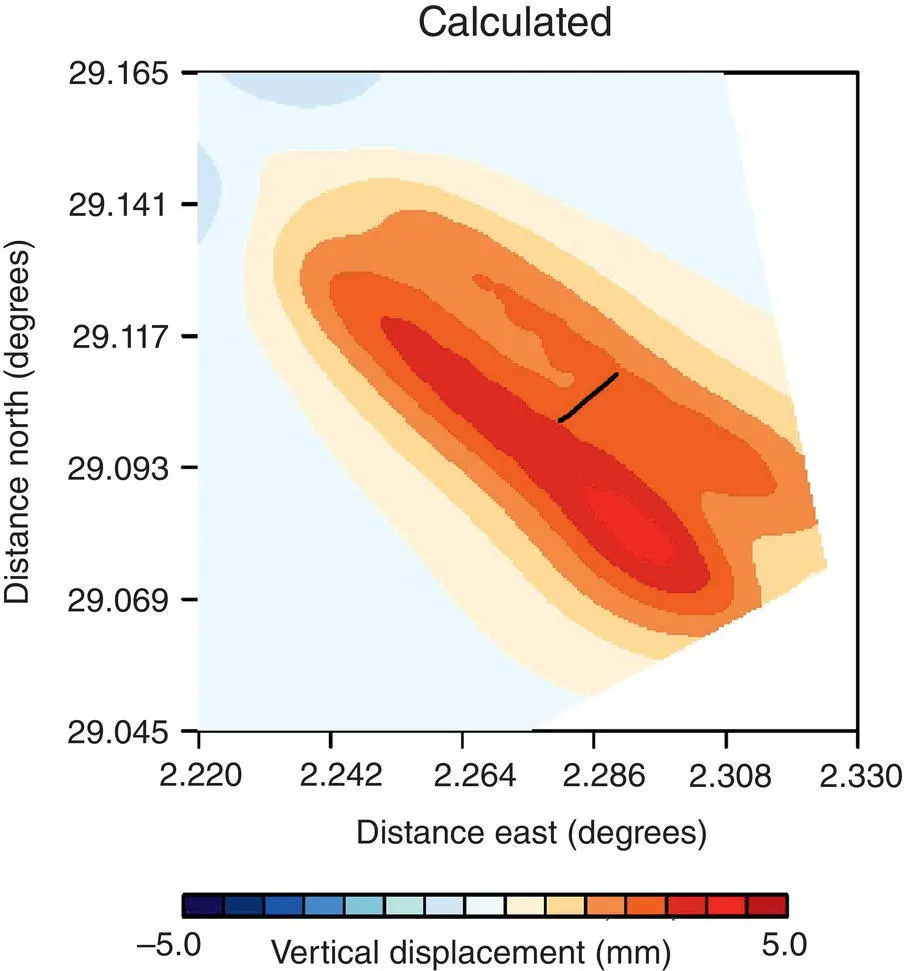
Figure 2.8 Calculated vertical displacement based upon the distribution of aperture change plotted in Figure 2.7.
A key objective of the Aquistore project is to integrate numerous data sets in order to determine the subsurface fluid distribution, pressure changes, and ground deformation associated with the injection. For these purposes, a variety of surface‐based, continuous‐recording instruments were installed at the site including Global Navigation Satellite System (GNSS) receivers, tiltmeters, seismographs, and piezometers. Space‐borne Differential Interferometric Synthetic Aperture Radar (DInSAR) is used to measure the ground deformation over a large area surrounding the site. Ascending and descending RADARSAT‐2 Spotlight and Wide Ultra‐Fine SAR data are gathered in order to achieve a high temporal and spatial sampling of the deformation field. The footprints of the SAR images are shown in Figure 2.9. The Spotlight data consist of ascending Spotlight 18 and descending Spotlight 12 images ( Fig. 2.9), acquired with the incidence angles of 44° and 40° and the range‐azimuth spatial resolution of 1.6x0.8 m. The Wide Ultra‐Fine data consist of both ascending and descending Wide 2 Ultra‐Fine images, acquired with an incidence angle of 37° and the range‐azimuth spatial resolution of 1.6x2.8 m. Combining the four independent data sets decreases the time between surveys from 24 days to 6 days. A LIDAR digital elevation map with 1 m resolution was used to remove the phase changes due to topography.
Читать дальшеИнтервал:
Закладка:
Похожие книги на «Geophysical Monitoring for Geologic Carbon Storage»
Представляем Вашему вниманию похожие книги на «Geophysical Monitoring for Geologic Carbon Storage» списком для выбора. Мы отобрали схожую по названию и смыслу литературу в надежде предоставить читателям больше вариантов отыскать новые, интересные, ещё непрочитанные произведения.


Обсуждение, отзывы о книге «Geophysical Monitoring for Geologic Carbon Storage» и просто собственные мнения читателей. Оставьте ваши комментарии, напишите, что Вы думаете о произведении, его смысле или главных героях. Укажите что конкретно понравилось, а что нет, и почему Вы так считаете.