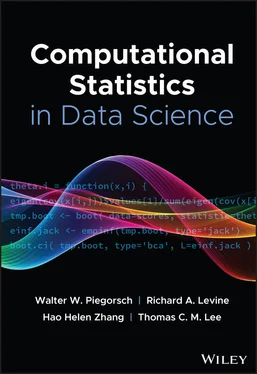
Computational Statistics in Data Science
Здесь есть возможность читать онлайн «Computational Statistics in Data Science» — ознакомительный отрывок электронной книги совершенно бесплатно, а после прочтения отрывка купить полную версию. В некоторых случаях можно слушать аудио, скачать через торрент в формате fb2 и присутствует краткое содержание. Жанр: unrecognised, на английском языке. Описание произведения, (предисловие) а так же отзывы посетителей доступны на портале библиотеки ЛибКат.
- Название:Computational Statistics in Data Science
- Автор:
- Жанр:
- Год:неизвестен
- ISBN:нет данных
- Рейтинг книги:4 / 5. Голосов: 1
-
Избранное:Добавить в избранное
- Отзывы:
-
Ваша оценка:
- 80
- 1
- 2
- 3
- 4
- 5
Computational Statistics in Data Science: краткое содержание, описание и аннотация
Предлагаем к чтению аннотацию, описание, краткое содержание или предисловие (зависит от того, что написал сам автор книги «Computational Statistics in Data Science»). Если вы не нашли необходимую информацию о книге — напишите в комментариях, мы постараемся отыскать её.
Computational Statistics in Data Science
Computational Statistics in Data Science
Wiley StatsRef: Statistics Reference Online
Computational Statistics in Data Science
Computational Statistics in Data Science — читать онлайн ознакомительный отрывок
Ниже представлен текст книги, разбитый по страницам. Система сохранения места последней прочитанной страницы, позволяет с удобством читать онлайн бесплатно книгу «Computational Statistics in Data Science», без необходимости каждый раз заново искать на чём Вы остановились. Поставьте закладку, и сможете в любой момент перейти на страницу, на которой закончили чтение.
Интервал:
Закладка:
Blaze is a high‐performance math library for dense/sparse arithmetic developed by Iglberger et al . [18]. Blaze extensively uses LAPACK functions for various computing tasks, such as matrix decomposition and inversion, providing high‐performance computing. Blaze supports high‐performance parallex (HPX) [20] and OpenMP to enable parallel computing.
The difficulty to develop C  programs limits its use as a primary statistical software package. Yet, C
  appeals when a fast, production‐quality program is desired. Therefore, R and Python developers may find C
  knowledge beneficial to optimize their code prior to distribution. We see C/C
  as the standard for speed and, as such, an attractive tool for big data problems.
3.3 Microsoft Excel/Spreadsheets
Much of statistical work today involves the use of Microsoft Excel and other spreadsheet‐style applications (Google Sheets, Apple Numbers, etc.). A spreadsheet application provides a simple and interactive way to collect data. This has an appeal for any manual data entry process. The sheets are easy to share, both through traditional file sharing (e.g., e‐mail attachments) and cloud‐based solutions (Google Drive, Dropbox, etc.). Simple numeric summaries and plots are easy to construct. More advanced macros/scripts are possible, yet most data scientists would prefer to switch to a more full‐featured environment (such as R or Python). Yet, as nearly all computer workers have some level of familiarity with spreadsheets, spreadsheets remain hugely popular and ubiquitous in organizations. Thus, we wager that spreadsheet applications will likely always be involved in statistical software and posit they can be quite efficient for appropriate tasks.
3.4 Git
Very briefly, we mention Git, a free and open‐source distributed version control system ( https://git‐scm.com/). As the complexities of modern data science workflows increase, statistical programmers are increasingly reliant on some type of version control system, with Git being the most popular. Git allows for a branching scheme to foster experimentation in projects and to converge to a final product. By compiling a complete history of a project, Git provides transparent data analyses for reproducible research. Further, projects and software can be shared easily via web‐based repositories, such as GitHub ( https://github.com/).
3.5 Java
Java is one of the most popular programming languages (according to the TIOBE index, www.tiobe.com/tiobe‐index/), partially due to its extensive library ecosystem. Java's design seduces programmers – it is simple, object oriented, and portable. Java applications run on any machine, from personal laptops to high‐performance supercomputers, even game consoles and internet of things (IoT) devices. Notably, Android (based on Java) development has driven recent Java innovations. Java's “write once, run anywhere” adage provides versatility, triggering interest even at the research level.
Developers may prefer Java for intensive calculations performing slowly within scripted languages (e.g., R). For speed‐up purposes, Java's cross‐platform design could even be preferred to C/C  in certain cases. Alternatively, Java code can be wrapped nicely in an R package for faster processing. For example, the rJava package allows one to call java code in an R script and also reversely (calling R functions in Java). On the other hand, Java can be used independently for statistical analysis, thanks to a nice set of statistical libraries.
Popular sources of native Java statistical and mathematical functionalities are JSC (Java Statistical Classes) and Apache Commons Math application programming interfaces (APIs) ( http://commons.apache.org/proper/commons‐math/). JSC and Apache Commons Math libraries perform many methods including univariate statistics, parametric and nonparametric tests (  ‐test, chi‐square test, and Wilcoxon test), random number generation, random sampling/resampling, regression, correlation, linear or stochastic optimization, and clustering.
Additionally, Java boasts an extensive number of machine‐learning packages and big data capabilities. For example, Java enables the WEKA [21] tool, the JSAT library [22], and the TensorFlow framework [23]. Moreover, Java provides one of the most desired and useful big data analysis tools – Apache Spark [24]. Spark provides ML support through modules in the Spark MLlib library [25].
As with other discussed software, Java APIs often require importing other packages/libraries. For example, developers commonly use external matrix‐operation libraries, such as JAMA (Java matrix package, https://math.nist.gov/javanumerics/jama/) or EJML (efficient Java matrix library, http://ejml.org/wiki/). Such packages allow for routine computation – for example, matrix decomposition and dense/sparse matrix calculation. JFreeCHart enables data visualization by generating scatter plots, histograms, barplots, and so on. Recently, these Java libraries are being replaced by more popular JavaScript libraries such as Plot.ly ( https://plot.ly/), Bokeh (bokeh.pydata.org), D3 [26], or Highcharts ( www.highcharts.com).
As outlined above, Java could serve as a useful statistical software solution, especially for developers familiar with it or who have interest in cross‐platform development. We would then recommend its use for seasoned programmers looking to add some statistical punch to their desktop, web, and mobile apps. For the analysis of big data, Java offers some of the best ML tools available.
3.6 JavaScript, Typescript
JavaScript is one of the most popular programming languages, outpacing even Java and Python. It is fully featured, flexible, and fast, leading to its broad appeal. JavaScript excels at visualization through D3.js . JavaScript even features interactive, browser‐based ML via TensorFlow.js . For real‐time data collection and analysis, JavaScript provides streaming tools through MongoDB . JavaScript's unsurpassed popularity alone makes it worth a look, especially if tasked with a complex real‐time data analytic challenge across heterogeneous architectures.
3.7 Maple
Maple is a “math software that combines the world's most powerful math engine with an interface that makes it extremely easy to analyze, explore, visualize, and solve mathematical problems.” ( https://www.maplesoft.com/products/Maple/). While not specifically a statistical software package, Maple's computer algebra system is a handy supplement to an analyst's toolkit. Often in statistical computing, a user may employ Maple to check a hand calculation or reduce the workload/error rate in lengthy derivations. Moreover, Maple offers add‐on packages for statistics, calculus, analysis, linear algebra, and more. One can even create interactive plots and animations. In sum, Maple is a solid choice for a computer algebra system to aid in statistical computing.
Читать дальшеИнтервал:
Закладка:
Похожие книги на «Computational Statistics in Data Science»
Представляем Вашему вниманию похожие книги на «Computational Statistics in Data Science» списком для выбора. Мы отобрали схожую по названию и смыслу литературу в надежде предоставить читателям больше вариантов отыскать новые, интересные, ещё непрочитанные произведения.
Обсуждение, отзывы о книге «Computational Statistics in Data Science» и просто собственные мнения читателей. Оставьте ваши комментарии, напишите, что Вы думаете о произведении, его смысле или главных героях. Укажите что конкретно понравилось, а что нет, и почему Вы так считаете.
![Роман Зыков - Роман с Data Science. Как монетизировать большие данные [litres]](/books/438007/roman-zykov-roman-s-data-science-kak-monetizirova-thumb.webp)


