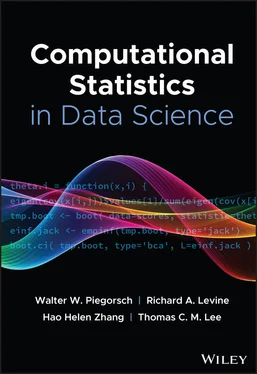
Computational Statistics in Data Science
Здесь есть возможность читать онлайн «Computational Statistics in Data Science» — ознакомительный отрывок электронной книги совершенно бесплатно, а после прочтения отрывка купить полную версию. В некоторых случаях можно слушать аудио, скачать через торрент в формате fb2 и присутствует краткое содержание. Жанр: unrecognised, на английском языке. Описание произведения, (предисловие) а так же отзывы посетителей доступны на портале библиотеки ЛибКат.
- Название:Computational Statistics in Data Science
- Автор:
- Жанр:
- Год:неизвестен
- ISBN:нет данных
- Рейтинг книги:4 / 5. Голосов: 1
-
Избранное:Добавить в избранное
- Отзывы:
-
Ваша оценка:
- 80
- 1
- 2
- 3
- 4
- 5
Computational Statistics in Data Science: краткое содержание, описание и аннотация
Предлагаем к чтению аннотацию, описание, краткое содержание или предисловие (зависит от того, что написал сам автор книги «Computational Statistics in Data Science»). Если вы не нашли необходимую информацию о книге — напишите в комментариях, мы постараемся отыскать её.
Computational Statistics in Data Science
Computational Statistics in Data Science
Wiley StatsRef: Statistics Reference Online
Computational Statistics in Data Science
Computational Statistics in Data Science — читать онлайн ознакомительный отрывок
Ниже представлен текст книги, разбитый по страницам. Система сохранения места последней прочитанной страницы, позволяет с удобством читать онлайн бесплатно книгу «Computational Statistics in Data Science», без необходимости каждый раз заново искать на чём Вы остановились. Поставьте закладку, и сможете в любой момент перейти на страницу, на которой закончили чтение.
Интервал:
Закладка:
We also mention another popular extensible text editor Vim ( https://www.vim.org/). Vim offers many of the same benefits as Emacs. There is a constant debate over the superiority of either Vim or Emacs. We avoid this discussion here and simply admit that the first author is an Emacs user, leading to the discussion above. This is not a vote of confidence toward Emacs over Vim but simply a reflection of familiarity.
1.2 Jupyter Notebooks
The Jupyter Project is an effort to develop open‐source software and services for interactive computing across a variety of popular programming languages such as Python, R, Julia, and C++. The interactive environment is based on notebooks which contain text cells and code cells. Text cells can utilize a mix of plain text, markdown, and render LaTeX through the Mathjax engine. Code cells can be run, modified, and rerun in any order. This functionality makes it easy to perform data analyses and document your work as you go.
The Jupyter IDE (integrated development environment) is run locally in a web browser and can be configured for remote and multiuser workflows. Since reproducible data science is a core feature of the Jupyter Project, they have made it so that notebooks can be exported and shared online as an interactive document or as a static HTML or PDF document. Services such as mybinder.org let a user upload and run notebooks online so that an analysis is instantly reproducible by anyone.
1.3 RStudio and Rmarkdown
RStudio is an organization that develops free and enterprise‐ready tools for working with the R language. Their IDE (also called RStudio ) integrates the R console, file browser, script editor, and more in one unified user interface. Through the use of project‐associated directories/files, the entire projects are nearly self‐contained and easily shared among different systems.
Similar to Jupyter Notebooks, RStudio supports a file format called Rmarkdown that allows for code to be embedded and executed in a markdown‐style document. The basic setup is a YAML ( https://yaml.org/) header, markdown text, and code chunks . This simple structure can be built upon through the use of the knitr package that can build PDF, HTML, or XML (MS Word) documents and – via the R package rticles – build journal‐style documents from the same basic file format. Knitr can also create slideshows just by changing a parameter in the YAML header. This kind of flexibility for document creation is a huge (and unique) advantage to using Rmarkdown, and it is easily done using the RStudio IDE. Notably, Rmarkdown supports many other programming engines besides R, such as Python, C++, and Julia.
2 Popular Statistical Software
With introductory matters behind, we now transition to discussions of the most popular statistical computing languages. We begin with R, our preferred statistical programming language. This leads to an unbalanced discussion compared to the other most popular statistical software (Python, SAS, and SPSS); yet we hope to provide objective recommendations despite the unequal coverage.
2.1 R
R [1] began at the University of Auckland, New Zealand, in the early 1990s. Ross Ihaka and Robert Gentleman needed a statistical environment to use in their teaching lab. At the time, their computer labs featured only Macintosh computers that lacked suitable software. Ihaka and Gentleman decided to implement a language based on an S‐like syntax [2]. R's initial versions were provided to Statlib at Carnegie Mellon University, and the user feedback indicated a positive reception.
R's success encouraged its release under the Open Source Initiative ( https://opensource.org/). Developers released the first version in June 1995. A software system under the open‐source paradigm benefits from having “many pairs of eyes to develop the software.” R developed a huge following, and it soon became difficult for the developers to maintain. As a response, a 10‐member core group was formed in 1997. The core team handles any changes to the R source code. The massive R community provides support via online mailing lists ( https://www.r‐project.org/mail.html) and statistical computing forums – such as Talk Stats ( http://www.talkstats.com/), Cross Validated ( https://stats.stackexchange.com/), and Stack Overflow ( https://stackoverflow.com/). Often users receive responses within a matter of minutes.
Since humble beginnings, R has developed into a popular, complete, and flexible statistical computing environment that is appreciated by academia, industry, and government. R's main benefits include support on all major operating systems and comprehensive package archives. Further, R integrates well with document formats (such as LaTeX ( https://www.latex‐project.org/), HTML, and Microsoft Word) through R Markdown ( https://rmarkdown.rstudio.com/) and other file formats to enhance literate programming and reproducible data analysis.
R provides extensive statistical capacity. Nearly any method is available as an R package – the trick is locating the software. The base package and default included packages perform most standard analyses and computation. If the included packages are insufficient, one can use CRAN (the comprehensive R archive network) that houses nearly 13 000 packages (visit https://cran.r‐project.org/for more information). To help navigate CRAN, “CRAN Task Views” organizes packages into convenient topics ( https://cran.r‐project.org/web/views/). For bioinformatics, over 1500 packages reside on Bioconductor [3]. Developers also distribute their packages via git repositories, such as github ( https://github.com/). For easy retrieval from github, the devtools package allows direct installation.
2.1.1 Why use R over Python or Minitab?
R is tailored to working with data and performing statistical analysis in a way that is more consistent and extensible than Python. The syntax for accessing data in lists and data frames is convenient with tab completion showing what elements are in an object. Creating documents, reports, notebooks, presentations, and web pages is possible through Rmarkdown/RStudio.
Through the use of the metapackage tidyverse or the library data.table , working with tabular data is direct, efficient, and intuitive. Because R is a scripted language, reproducible workflows are possible, and steps in the process of extracting and transforming data are easy to go back and modify without disrupting the analysis. While this is a virtue shared among all scripting languages, the nature of reproducible results and modular code saves time compared to a point‐and‐click interface like that of Excel or Minitab.
2.1.2 Where can users find R support?
R has a large community for support online and even built‐in documentation within the software. Most libraries provide documentation and examples for their functions and objects that can be accessed via the ? in the command line (e.g., type ?glmfor help about creating a generalized linear model). These help documents are displayed directly in the console, or if using RStudio, they are displayed in the help panel with extra links to related functions. For more in‐depth documentation, some developers provide vignettes for their packages. Vignettes are long‐form documentation that demonstrates how to use the functionality in the package and tie it together with a working example.
The online R community is lively, and the people are often helpful. Searching for any question about R or its packages will often lead you to a post on Stack Overflow ( https://stackoverflow.com/) or Reddit (either r/rstats or r/RStudio). There is also the RStudio Community ( https://community.rstudio.com/) where you can go to ask questions about features specific to the IDE. It is rare to encounter an R programming challenge that has not been addressed somewhere online and, in that case, a well‐posed question posted on such forums is quickly answered. Twitter also has an active community of developers that can sometimes respond directly (such as # RSTUDIO or HADLEYWICKHAM).
Читать дальшеИнтервал:
Закладка:
Похожие книги на «Computational Statistics in Data Science»
Представляем Вашему вниманию похожие книги на «Computational Statistics in Data Science» списком для выбора. Мы отобрали схожую по названию и смыслу литературу в надежде предоставить читателям больше вариантов отыскать новые, интересные, ещё непрочитанные произведения.
Обсуждение, отзывы о книге «Computational Statistics in Data Science» и просто собственные мнения читателей. Оставьте ваши комментарии, напишите, что Вы думаете о произведении, его смысле или главных героях. Укажите что конкретно понравилось, а что нет, и почему Вы так считаете.
![Роман Зыков - Роман с Data Science. Как монетизировать большие данные [litres]](/books/438007/roman-zykov-roman-s-data-science-kak-monetizirova-thumb.webp)


