Rethinking Prototyping
Здесь есть возможность читать онлайн «Rethinking Prototyping» — ознакомительный отрывок электронной книги совершенно бесплатно, а после прочтения отрывка купить полную версию. В некоторых случаях можно слушать аудио, скачать через торрент в формате fb2 и присутствует краткое содержание. Жанр: unrecognised, на английском языке. Описание произведения, (предисловие) а так же отзывы посетителей доступны на портале библиотеки ЛибКат.
- Название:Rethinking Prototyping
- Автор:
- Жанр:
- Год:неизвестен
- ISBN:нет данных
- Рейтинг книги:3 / 5. Голосов: 1
-
Избранное:Добавить в избранное
- Отзывы:
-
Ваша оценка:
Rethinking Prototyping: краткое содержание, описание и аннотация
Предлагаем к чтению аннотацию, описание, краткое содержание или предисловие (зависит от того, что написал сам автор книги «Rethinking Prototyping»). Если вы не нашли необходимую информацию о книге — напишите в комментариях, мы постараемся отыскать её.
The Design Modelling Symposium Berlin 2013 would like to challenge the participants to reflect on the possibility of computational systems that bridge design phase and occupancy of buildings. This rethinking of the designed artifact beyond its physical has had profound effects on other industries already. How does it affect architecture and engineering?
At the scale of engineering and building systems new perspectives may open up by engaging built form as a continuous prototype, which can track and respond during use and serve as a real world implementation of its design model. This has been tried many times from intelligent façades to smart homes and networked grids but much of it was only technology driven and not approached from a more holistic design perspective.
Rethinking Prototyping — читать онлайн ознакомительный отрывок
Ниже представлен текст книги, разбитый по страницам. Система сохранения места последней прочитанной страницы, позволяет с удобством читать онлайн бесплатно книгу «Rethinking Prototyping», без необходимости каждый раз заново искать на чём Вы остановились. Поставьте закладку, и сможете в любой момент перейти на страницу, на которой закончили чтение.
Интервал:
Закладка:
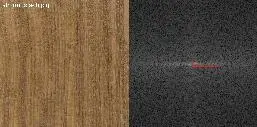
Fig. 4 Sample image Afrormosia (left) and the corresponding FFT (right) with filter boundary (red)
The real part of the Fourier transformation of a 4 x 4 matrix stores the following values:

The imaginary part of the same matrix stores the following values:
These symbolic representations show that the top-left (0,0) values of each quadrant only appear once in the real part and are all zero in the imaginary part. All the other values symmetrically appear twice (colour index in Formula 5). In the imaginary part, the second appearance of these values is multiplied with -1. The library makes use of this redundancy by offering another version of the Fourier transformation. It returns a matrix of not complex but only double numbers, the two parts being interwoven into each other. This can be of great value because of the smaller memory needs. For the study presented here however, the author decided to neglect this because on one hand, the application of filters (high-pass, low-pass, band-pass, etc.) is more comfortable on the complex number matrix. On the other hand, the interwoven method requires the matrix to be square with 2n (n ϵ ℕ) rows and columns.
3.3 Application of Filters
The bright dots in Fig. 4 (right) represent high magnitudes. That means, these frequencies contribute a lot to the contrast distribution of the image, the darker dots only are responsible for little variations. By applying a rectangular low-pass filter (50 columns wide, 10 rows high or approximately 0.8 % of the original data) and reconstructing the image by only using the values within the red rectangle in Fig. 4 (right) and discarding all the rest, an image containing all the large scale features of the original input image is retrieved (Fig. 5, left). The corresponding high pass filtered image (Fig. 5, center) is globally much more monochromatic and contains all small-scale details such as the cut vessels. A rebuilt image with a low pass filter of the same size but inversed dimensions applied is shown in Fig. 5 (right). The image is much more blurred and contains less relevant details. This is typical for wood cut parallel to the grain. Features like quilt or flame on the other hand are only recognized when including these spectrums as well (Fig. 8). Usually, the term low-pass filter refers to a circular region centered around the origin. Due to the predominantly vertical orientation of most of the wood textures, an asymmetric rectangular region has been chosen. In the custom tool, dimensions and position of the filter can be adjusted freely.
A reduction to the same amount of data points (ca. 500 * 3) but without the prior shift to the frequency domain is shown in Fig. 13. The down sampled 23 by 23 pixels version only vaguely preserves the main traces of the original input image.


Fig. 5 Reconstructed image using a low-pass filter (1st) and the corresponding high-pass filter (2nd) / filter dimensions inversed to ten columns wide and 50 rows high (3rd)
The reconstruction of the image is done by first setting all the values outside of the red rectangle (low pass, inside for the high pass) to zero and then calculating the inverse Fourier transformation (IFFT) of the red, the green and the blue matrix.
3.4 Colour Space
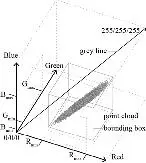
Fig. 6 RGB colour cube with image point cloud and bounding box
After the values are Fourier transformed, filtered and then inverse transformed again, they are not in the same absolute range anymore but only keep their relative proportion. In order to again achieve the same chromaticity of the input image, the values have to be mapped to the original colour space. For that reason, the minimum and maximum value of each channel ( red, green and blue ) are stored. These limits describe a rhomboid within the entire colour cube. This rhomboid is the bounding box of the point cloud, where each pixel represents a point defined by the channels as its coordinates.
In a grey scale image, each pixel’s colour value has identical red, green and blue content. They all would sit on the diagonal line going from black (0/0/0) to white (255/255/255). Because of the linear dependence, an alternative description could be therefore

3.5 Eigenvector
In the above formula (7),  is the unit vector and λ is a factor ranging from zero to 255. Fig. 6 shows that the point cloud of the original image has one very clear axis of main extension. This axis corresponds approximately to ΔR/ΔG/ΔB. A method to determine the direction and magnitude of this vector precisely is the Eigenvalue decomposition. This procedure delivers what could be described as a data specific coordinate system. For an n -dimensional dataset, this consists of n linearly independent vectors (Eigenvector) and their corresponding scalars. Thereby, the first vector spans along the biggest variance in the input data. The following mutually perpendicular vectors have smaller and smaller scalars. Eigenvalue decomposition is used in principal component analysis (PCA), for example. Principal component because these are what matters most. Depending on the dataset, by only using the first few eigenvector or value pairs, it can be reconstructed with very high accuracy. In the present case, the colours C of the rebuilt image can be set to
P is the centre of gravity of the point cloud,  is the first of the three eigenvectors, λ is again a scaling factor and d is the biggest diameter of the point cloud. Most wood texture images have a certain tonality equal over the entire image. A reconstruction applying this dimensionality reduction (projection of all the points on one line in space) still produces a very accurate result (Fig. 7, right) hardly distinguishable from the original.
Интервал:
Закладка:
Похожие книги на «Rethinking Prototyping»
Представляем Вашему вниманию похожие книги на «Rethinking Prototyping» списком для выбора. Мы отобрали схожую по названию и смыслу литературу в надежде предоставить читателям больше вариантов отыскать новые, интересные, ещё непрочитанные произведения.

Обсуждение, отзывы о книге «Rethinking Prototyping» и просто собственные мнения читателей. Оставьте ваши комментарии, напишите, что Вы думаете о произведении, его смысле или главных героях. Укажите что конкретно понравилось, а что нет, и почему Вы так считаете.