Rethinking Prototyping
Здесь есть возможность читать онлайн «Rethinking Prototyping» — ознакомительный отрывок электронной книги совершенно бесплатно, а после прочтения отрывка купить полную версию. В некоторых случаях можно слушать аудио, скачать через торрент в формате fb2 и присутствует краткое содержание. Жанр: unrecognised, на английском языке. Описание произведения, (предисловие) а так же отзывы посетителей доступны на портале библиотеки ЛибКат.
- Название:Rethinking Prototyping
- Автор:
- Жанр:
- Год:неизвестен
- ISBN:нет данных
- Рейтинг книги:3 / 5. Голосов: 1
-
Избранное:Добавить в избранное
- Отзывы:
-
Ваша оценка:
Rethinking Prototyping: краткое содержание, описание и аннотация
Предлагаем к чтению аннотацию, описание, краткое содержание или предисловие (зависит от того, что написал сам автор книги «Rethinking Prototyping»). Если вы не нашли необходимую информацию о книге — напишите в комментариях, мы постараемся отыскать её.
The Design Modelling Symposium Berlin 2013 would like to challenge the participants to reflect on the possibility of computational systems that bridge design phase and occupancy of buildings. This rethinking of the designed artifact beyond its physical has had profound effects on other industries already. How does it affect architecture and engineering?
At the scale of engineering and building systems new perspectives may open up by engaging built form as a continuous prototype, which can track and respond during use and serve as a real world implementation of its design model. This has been tried many times from intelligent façades to smart homes and networked grids but much of it was only technology driven and not approached from a more holistic design perspective.
Rethinking Prototyping — читать онлайн ознакомительный отрывок
Ниже представлен текст книги, разбитый по страницам. Система сохранения места последней прочитанной страницы, позволяет с удобством читать онлайн бесплатно книгу «Rethinking Prototyping», без необходимости каждый раз заново искать на чём Вы остановились. Поставьте закладку, и сможете в любой момент перейти на страницу, на которой закончили чтение.
Интервал:
Закладка:
Mathias Bernhard
CAAD / ITA / DARCH / ETH Zurich, Switzerland
1 Introduction
Even though this paper deals with the analysis and synthesis of image textures, its primary goal is not to provide new algorithms for seamless texture synthesis used by rendering engines. However, a lot of the involved knowledge is gained from the relevant works (e.g. Szeliski 2011) in the field of computer graphics (CG), where these topics are profoundly described. The goal is rather to investigate in tools that can help architects in the design process. Architects and designers always used to work with references, with examining different answers to similar questions. How can the computer learn and help us learn from these references, available in a tremendous abundance and growing?
2 Why Wood?
2. Textural Richness
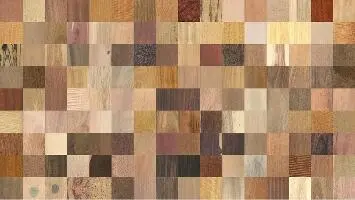
Fig. 1 144 of the wood texture samples that form the basis for this work
The examined wood textures present a huge variety of colours, from bright yellow over fiery red and royal purple to coffee brown. They distinguish from each other in an enormous richness of patterns and structures, like fiddle back flames, burls, birds’ eyes, quilts, masur and curly waves. At the same time, they share many common features. They all have regions of different densities, denser darker areas and less dense brighter areas. The textures are neither completely random (noise) nor deterministic (grid) but somewhere in between (stochastic). The periodicity of the occurrence of annual rings makes it an ideal topic for investigation with the presented process.
2.2 Sample Selection
All wood pieces are cut parallel to the fibers and then scanned. From the original dataset, also microscopic images, cuts perpendicular to the grain, quarter sawn, sealed and photos of products made of every wood are available. They are not being analyzed in the present work. Neither are other quantifiable aspects of the different sorts of wood like the regional provenance, physical coefficients such as elasticity, density or load bearing capacities.
2.3 Natural Wood
To do the experiments presented here with wood also has a provocative side. Wood in the public perception counts as warm, natural, pure, and honest, the least processed building material. It is supposed to grow in a wild forest, to be cut, planed and directly nailed onto the floor. Most of construction materials are processed - doped - to improve their fitness to meet the requirements, not only synthetic but also “natural” ones. Works of Christoph Schindler (Schindler and Salmerón Espinosa 2011) or Hironori Yoshida (Digitized Grain, Scan to Production, Yoshida 2012) are good examples of wood being tailored and customized to individual needs. The objects intrigue, make people think ‘What is this?’
3 Process / Technical Description
3.1 Data Preparation
The sample images of the scanned wood types (Meier 2007) are present in the form of JPG files in 8 bit RGB colour. To improve the comparability of the different types and for computational performance reasons, they are first sampled down to a 256 x 256 pixel images. The colour information of every single pixel is then split up in four different two-dimensional dense matrices of double values. The matrices contain the red, green, blue and luminosity value of the pixels colour, mapped to a range from 0 to 1. Luminosity L is calculated as
This conversion into grayscales returns a value much closer to the perceptible “brightness” than the brightness as in a hue/saturation/brightness (HSB) colour model, see Fig. 2.
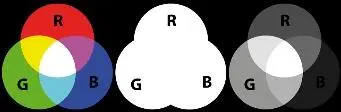
Fig. 2 Original colour image (left), conversion using brightness (centre), conversion using luminosity (right)
In HSB, the brightness is defined as the biggest of the three-colour channels and stands technically for the voltage needed to display the colour on a screen. In the Venn-diagram above, one of the channels is always 255, therefore the conversion returns all white.
Therefore, 256 x 256 x 3 (the fourth being calculated from the other three) means many data (196’608 floating point values) but not much meaning yet. The questions now are: Which are the most important ones? How do they – or at least some of them – relate to and depend on each other? Are there redundancies that one could get rid of?
3.2 Fourier Analysis
The idea of the procedure called Fourier Analysis (named after Jean Baptiste Joseph Fourier, 1768-1830) is that any signal (of any dimension) can be decomposed into a series of sine waves of different frequencies, magnitudes and phase angles. Fig. 3 shows the Fourier transform of a one-dimensional signal. The brightness values of one line of pixels (a) are fed into a one-dimensional matrix (b, x-axis=index, y-axis=value) from which the Fourier transform is calculated. The first eight component waves (d, wavelength 1/1, 1/2, 1/3, 1/4 …) are added up to form the inverse transform (c) being a low pass filtered approximation of the original curve. Fourier transform makes a translation from the time domain (or in the case of two-dimensional images spatial domain) into the frequency domain. The signals can be sound, heart pulses, stock market prices or raster images, where the intensities of each row and each column is computed.
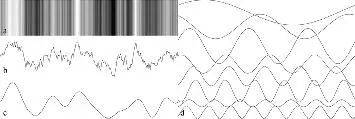
Fig. 3 Fourier analysis of a one-dimensional signal: original image, one line of pixels (a), corresponding section (b), reconstructed approximation or inverse transform (c) by overlaying the first eight individual frequencies (d)
The short introduction above is meant to give the reader who is unfamiliar with Fourier analysis some necessary basic knowledge. The mathematics involved are not described in further detail here. One is referred to specialist literature amply available. Implementations are also available with linear algebra libraries for most programming languages. Using the Java linear algebra library Parallel Colt (Wendykier and Nagy 2010), the Fast Fourier Transformation (FFT) of all the four matrices are calculated, resulting in four matrices of complex numbers. Fig. 4 shows one sample input image and the corresponding FFT-matrix of its luminosity channel. Following usual conventions, the values are shifted by half of the matrix’s dimension, so that the value of column 0 / row 0 appears in the center of the image. The grey level G of each pixel is calculated as
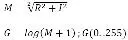
Where M is the magnitude, R the real part and I the imaginary part. Other possible quantities to be visualized are just the real part, just the imaginary part or the phase angles A , which are calculated as

Because these values contain negative values as well, either the absolute value should be taken or the values have to be normalized to range from - 1 ( black ) to 1 ( white ), 0 being a medium grey (128).
Читать дальшеИнтервал:
Закладка:
Похожие книги на «Rethinking Prototyping»
Представляем Вашему вниманию похожие книги на «Rethinking Prototyping» списком для выбора. Мы отобрали схожую по названию и смыслу литературу в надежде предоставить читателям больше вариантов отыскать новые, интересные, ещё непрочитанные произведения.

Обсуждение, отзывы о книге «Rethinking Prototyping» и просто собственные мнения читателей. Оставьте ваши комментарии, напишите, что Вы думаете о произведении, его смысле или главных героях. Укажите что конкретно понравилось, а что нет, и почему Вы так считаете.