Ernst Lueder - Liquid Crystal Displays
Здесь есть возможность читать онлайн «Ernst Lueder - Liquid Crystal Displays» — ознакомительный отрывок электронной книги совершенно бесплатно, а после прочтения отрывка купить полную версию. В некоторых случаях можно слушать аудио, скачать через торрент в формате fb2 и присутствует краткое содержание. Жанр: unrecognised, на английском языке. Описание произведения, (предисловие) а так же отзывы посетителей доступны на портале библиотеки ЛибКат.
- Название:Liquid Crystal Displays
- Автор:
- Жанр:
- Год:неизвестен
- ISBN:нет данных
- Рейтинг книги:4 / 5. Голосов: 1
-
Избранное:Добавить в избранное
- Отзывы:
-
Ваша оценка:
Liquid Crystal Displays: краткое содержание, описание и аннотация
Предлагаем к чтению аннотацию, описание, краткое содержание или предисловие (зависит от того, что написал сам автор книги «Liquid Crystal Displays»). Если вы не нашли необходимую информацию о книге — напишите в комментариях, мы постараемся отыскать её.
THE NEW EDITION OF THE GOLD-STANDARD IN TEACHING AND REFERENCING THE FUNDAMENTALS OF LCD TECHNOLOGIES
Liquid Crystal Displays — читать онлайн ознакомительный отрывок
Ниже представлен текст книги, разбитый по страницам. Система сохранения места последней прочитанной страницы, позволяет с удобством читать онлайн бесплатно книгу «Liquid Crystal Displays», без необходимости каждый раз заново искать на чём Вы остановились. Поставьте закладку, и сможете в любой момент перейти на страницу, на которой закончили чтение.
Интервал:
Закладка:
In Figure 4.8, the influence of the pretilt on the electro-distortional curve is depicted. The larger the pretilt, the smaller the voltage needed to tilt the molecules. This is understandable, as the molecules with larger pretilt are already rotated in the right direction.
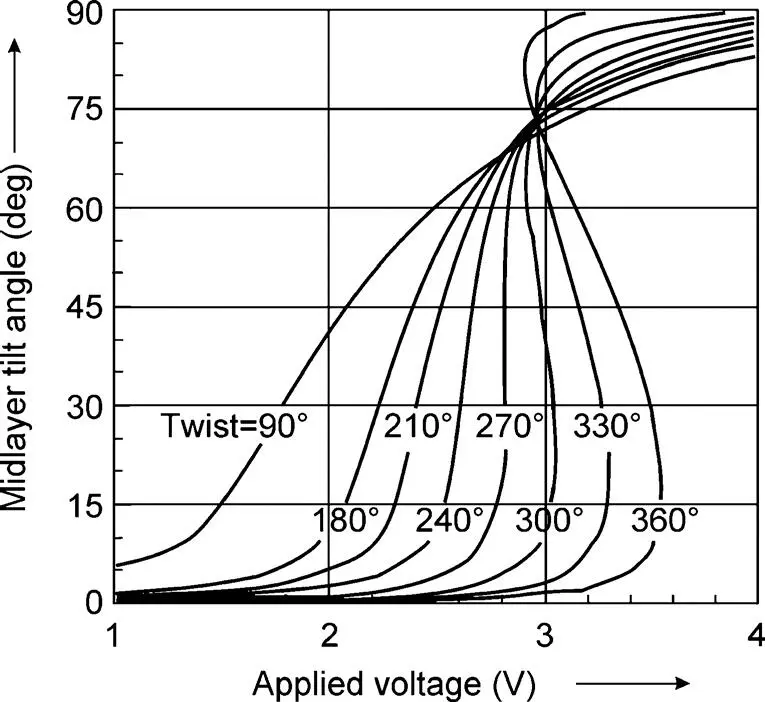
Figure 4.7Midlayer tilt versus voltage of an STN cell with twist angle β as a parameter (Reproduced from Scheffer and Nehring, 1998 with permission of Annual Reviews.)
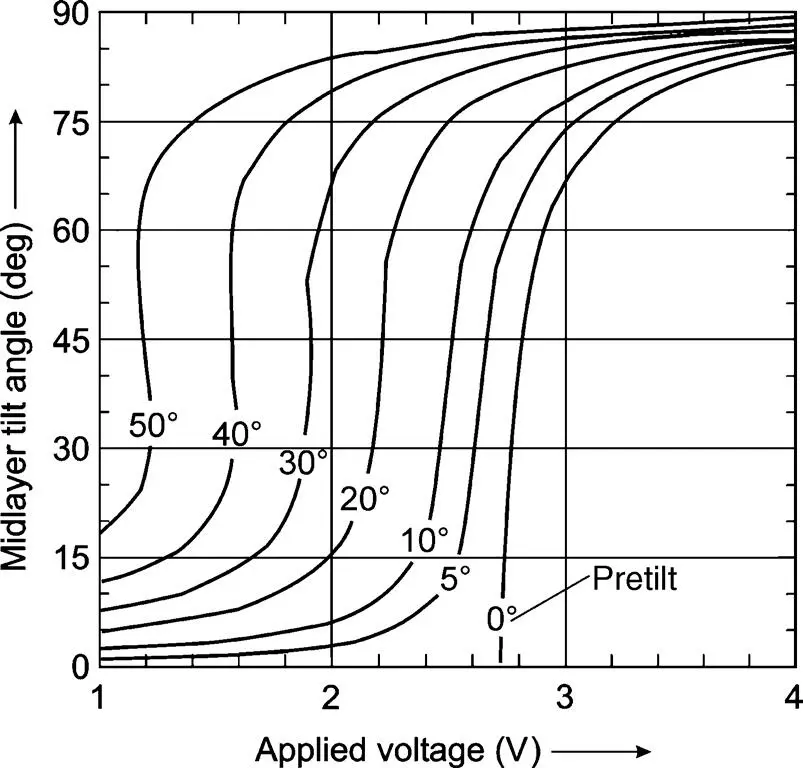
Figure 4.8The influence of the pretilt angle on the electro-distortional curve of the midlayer in an STN cell (Reproduced from Scheffer and Nehring, 1998 with permission of Annual Reviews.)
Finally, Figure 4.6shows both the midlayer tilt and the transmitted luminance versus V LCfor a twist of 240°. The transition from white to black is considerably steeper than for the regular 90° TN cell in Figure 2.13. It exhibits an extended linear range leading to a good grey scale operation. It is interesting to note that a sufficient black state occurs even when the midlayer has not yet reached 90°. In Figure 4.6, the display assumes a desired grey shade if voltages in between the on-voltage (fully black) and the off-voltage (fully white) are applied. The off and on voltages are 2.58V and 2.75 V, respectively representing a comparatively small voltage difference for switching a display with 240 lines.
The voltage-induced change of the orientation of the LC molecules also affects the colour appearance of an image. This is demonstrated in Figure 4.9, where the luminance vs. the wavelength of the display in Figure 4.6is shown. For an off-voltage of 2.58 V, the colouring is greenish-yellow. With increasing voltage, the display becomes bluer, ending up with dark blue at the on-voltage of 2.75 V. This mode is called the yellow mode, which is used in inexpensive displays. Other colours are generated with larger values for d Δ n . More on this colour generation is presented in Section 4.3.
4.2.3 The mixed mode twisted nematic cell (MTN cell)
In this mode the polarizer is at an angle α ≠ 0 to the x -axis while the director exhibits a twist β , in most cases β = π /2. The twist starts with the LC molecules anchored parallel to the x -axis. This situation gives rise to two modes of propagation of light from which the term mixed mode is derived.
The first mode is based on linearly polarized light feeding in both a wave with a field component parallel to the x -axis experiencing n ||and a wave with a y -component experiencing n ┴. As n ||> n ┴, the speed of propagation of the x -component is smaller than the speed of the y -component; the x -axis is the slow axis and the y -axis is the fast one. The effect at the output is based on this birefringence. Examples for this mode are all the untwisted nematic cells that were described in Chapter 3.
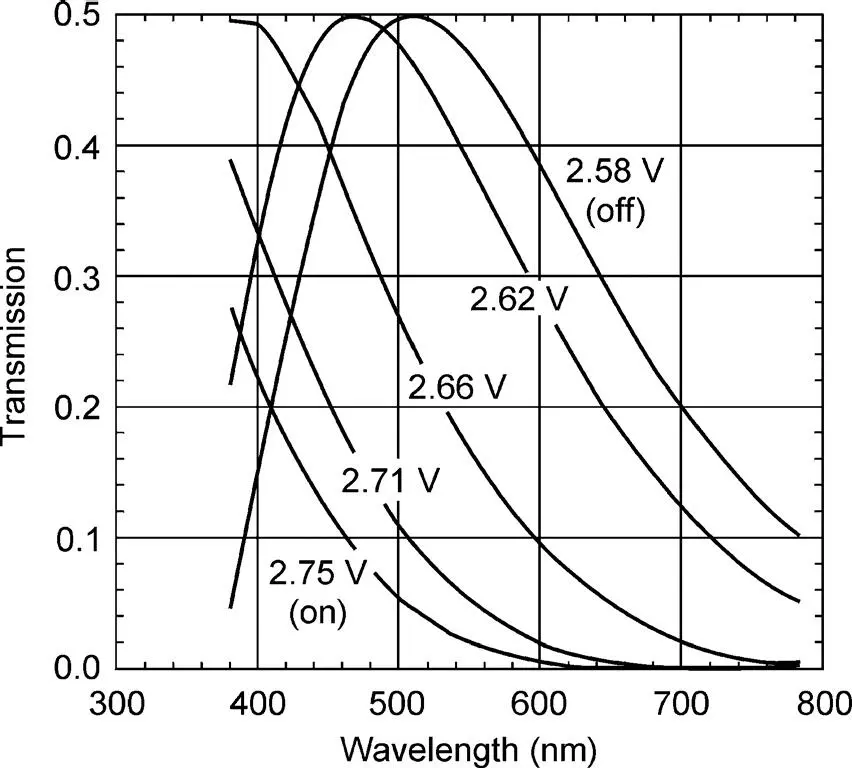
Figure 4.9Transmitted spectrum of a 240° STN display with the addressing voltage as a parameter (Reproduced from Scheffer and Nehring, 1998 with permission of Annual Reviews.)
The second mode stems from the twist of the molecules given in Equation (4.51)for α = 0, yielding
(4.77) 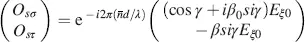
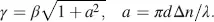
with
(4.78) 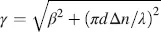
derived from Equation (4.64).
For β << πd Δ n / λ Equation (4.77)can be approximated by
(4.79) 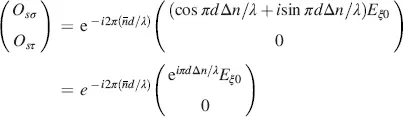
where β 0from Equation (4.50)was used. This result indicates that the component in the σ -axis represents the entire propagating wave. This axis rotates with the twist of the LC molecules we introduced during the derivation of the general result in Equation (4.51). Hence, the wave is guided by the twist. This waveguiding effect, also called the adiabatic following , is the second mode of propagation.
The derivation of the transmission in the MTN mode starts with the general Equations (4.66)and (4.67)for the Jones vectors in the x ′ – y ′ coordinates in Figure 4.1. We know from Equation (4.72)that maximum transmission takes place for ψ = − α , and the analyser in the ψ -direction. We now pursue this case, and obtain from Equations (4.66)and (4.67) ψ = − α for
(4.80) 
(4.81) 
The polarizers are crossed with a 90 angle for α = π /4, which as is shown in our discussion of Equation (4.76), yields a normally white state with an excellent black state. For α = π /4, Equations (4.80)and (4.81)yield
(4.82) 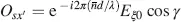
and
(4.83) 
The intensity Isx′ of the light passing through the polarizer in the x ′ direction in the normally white state with α = − ψ = π /4 is
(4.84) 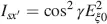
with
Isx ′is plotted in Figure 4.10versus a for β = π /2; zeros are at a = 0,  whereas maxima occur at
  The maximum at
  leads to
  . The fully on state offers an excellent black independent of λ . The normally black state with parallel polarizers possesses a black state for Osy′ = 0, that is, for γ ( λ ) = π . More on MTNs is presented in the following two chapters.
Интервал:
Закладка:
Похожие книги на «Liquid Crystal Displays»
Представляем Вашему вниманию похожие книги на «Liquid Crystal Displays» списком для выбора. Мы отобрали схожую по названию и смыслу литературу в надежде предоставить читателям больше вариантов отыскать новые, интересные, ещё непрочитанные произведения.


Обсуждение, отзывы о книге «Liquid Crystal Displays» и просто собственные мнения читателей. Оставьте ваши комментарии, напишите, что Вы думаете о произведении, его смысле или главных героях. Укажите что конкретно понравилось, а что нет, и почему Вы так считаете.