Richard J. Rossi - Applied Biostatistics for the Health Sciences
Здесь есть возможность читать онлайн «Richard J. Rossi - Applied Biostatistics for the Health Sciences» — ознакомительный отрывок электронной книги совершенно бесплатно, а после прочтения отрывка купить полную версию. В некоторых случаях можно слушать аудио, скачать через торрент в формате fb2 и присутствует краткое содержание. Жанр: unrecognised, на английском языке. Описание произведения, (предисловие) а так же отзывы посетителей доступны на портале библиотеки ЛибКат.

- Название:Applied Biostatistics for the Health Sciences
- Автор:
- Жанр:
- Год:неизвестен
- ISBN:нет данных
- Рейтинг книги:3 / 5. Голосов: 1
-
Избранное:Добавить в избранное
- Отзывы:
-
Ваша оценка:
Applied Biostatistics for the Health Sciences: краткое содержание, описание и аннотация
Предлагаем к чтению аннотацию, описание, краткое содержание или предисловие (зависит от того, что написал сам автор книги «Applied Biostatistics for the Health Sciences»). Если вы не нашли необходимую информацию о книге — напишите в комментариях, мы постараемся отыскать её.
APPLIED BIOSTATISTICS FOR THE HEALTH SCIENCES Applied Biostatistics for the Health Sciences
Applied Biostatistics for the Health Sciences
Applied Biostatistics for the Health Sciences — читать онлайн ознакомительный отрывок
Ниже представлен текст книги, разбитый по страницам. Система сохранения места последней прочитанной страницы, позволяет с удобством читать онлайн бесплатно книгу «Applied Biostatistics for the Health Sciences», без необходимости каждый раз заново искать на чём Вы остановились. Поставьте закладку, и сможете в любой момент перейти на страницу, на которой закончили чтение.
Интервал:
Закладка:
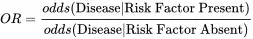
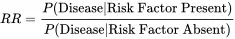
Ordinal VariableA qualitative variable is called an ordinal variable when there is a natural ordering of the possible values of the variable.ParameterA parameter is a numerical value that summarizes a particular characteristic of the population.PercentileThe pth percentile of a quantitative variable is the value in the population where p percent of the population falls below this value. The pth percentile is denoted by xp for values of p between 0 and 100.Positive Predictive ValueIn a diagnostic test, the positive predictive value (PPV) is the probability of a correct positive test result, P(+|D).ProbabilityA probability is a number between 0 and 1 that measures how likely it is for an event to occur.Qualitative VariableA variable that takes on non-numeric values is called a qualitative variable.Quantitative VariableA variable that takes on only numeric values is called a quantitative variable.Relative RiskThe relative risk is of a condition or disease for a dichotomous risk factor is the ratio of the probabilities P(Disease|Risk Factor Present) and P(Disease|Risk Factor Absent).
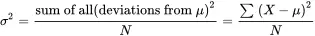
Response VariableThe response variable is the outcome variable of primary interest to a researcher.Sample SpaceThe set of all possible outcomes of a chance experiment is called the sample space and is denoted by S.SensitivityThe sensitivity is the conditional probability of a positive test for the subpopulation of individuals having the disease (i.e., P(+|D)).SpecificityThe specificity is the conditional probability of a negative test for the subpopulation of individuals who do not have the disease (i.e., P(−|not D)).Standard DeviationThe standard deviation of a population is defined to be the square root of the variance and will be denoted by σ.Standard NormalThe standard normal is a normal distribution with mean 0 and standard deviation 1.VarianceThe variance of a variable X measured on a population consisting of N units is
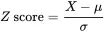
Z ScoreA Z score is a measure of relative position within a distribution and measures how many standard deviations a point is above or below the mean.
Exercises
1 2.1What is the difference between a qualitative and a quantitative variable?
2 2.2What is the difference between a discrete and a continuous variable?
3 2.3What is the difference between a nominal and an ordinal variable?
4 2.4Determine whether each of the following variables is a qualitative or quantitative variable.AgeSystolic blood pressureRaceGenderPain level
5 2.5Determine whether each of the following variables is a qualitative or quantitative variable. If the variable is a quantitative variable, determine whether it is a discrete or a continuous variable. If the variable is a qualitative variable, determine whether it is a nominal or an ordinal variable.GenderEthnicityDosage of a drug given in whole mgAbdomen circumferenceWhite blood countBody mass index (BMI)Eye colorSurvival time after diagnosis with pancreatic cancerNumber of months since last check upNumber of sexual partners in the last 6 months
6 2.6Determine whether each of the following qualitative variables is a nominal or an ordinal variable. The values that the variable can take on are listed in parentheses following the name of the variable.Gender (M, F)Size of hospital (small, average, large)Blood type (A, B, AB, O)Radiation dosage (low, medium, high)Use of dietary supplements (yes, no)Fat in diet (low, medium, high)Eat lunch (always, sometimes, never)
7 2.7 The percentages given in Table 2.13 were extracted from a bar chart published in the article “Prevalence of overweight among persons aged 2–19 years, by sex—National Health and Nutrition Examination Survey (NHANES), United States, 1999–2000 through 2003–2004” in the November 17, 2006 issue of the Morbidity and Mortality Weekly Report (MMWR), a Centers for Disease Control and Prevention weekly publication. Table 2.13 Prevalence of Overweight Children According to an Article in the November 17, 2006 Issue of MMWRGenderYear1999–20002001–20022003–2004Male1416.518.2Female13.81416Create a side-by-side bar chart representing the percentages of overweight children for each gender by year.Create a side-by-side bar chart representing the percentages of overweight children for each year by gender.
8 2.8 The percentages in Table 2.14 were extracted from a bar chart published in the article “Percentage distribution of blood pressure categories among adults aged ≥18 years, by race/ethnicity—National Health and Nutrition Examination Survey, United States, 1999–2004” published in the June 22, 2007 issue of the Morbidity and Mortality Weekly Report, a Centers for Disease Control and Prevention weekly publication. Table 2.14 Percentages of Americans in the Blood Pressure Categories as Reported in the June 22, 2007 issue of MMWREthnicityBlood Pressure CategoryNormalPrehypertensionHypertensionHypertensionStage IStage IIMexican American4634128White4637116Black36381610Create a side-by-side bar chart representing the percentages for each of the blood pressure categories by ethnicity category.Create a side-by-side bar chart representing the percentages for each of the blood pressure categories within each ethnicity category.Which ethnicity appears to have the largest percentage in the hypertension stage I and II categories?
9 2.9The probability density of a continuous variable is given in Figure 2.32. If the points labeled A,B,C,D, and E represent the mode, mean, median, 25th percentile, and the 75th percentile, determine which of the points is the Figure 2.32 The probability distribution of the continuous variable X.median of this distribution.mode of this distribution.mean of this distribution.value that only 25% of the values in the population exceed.value that 50% of the values in the population exceed.value that 75% of the values in the population are less than.
10 2.10If the 25th and 75th percentiles of the distribution given in Figure 2.32 are 38 and 92, determine the value of the interquartile range.
11 2.11Use the distribution given in Figure 2.33 representing the hypothetical distribution for the survival times for stage IV pancreatic cancer patients to answer the following questions. Figure 2.33 The distribution for Exercise 2.11.Does the distribution appear to be multi-modal?How many modes does this distribution have?Is this distribution symmetric, long-tailed left, or long-tailed right?What is the value of the mode for this distribution?If the points A and B represent the mean and median, which of these two points is the mean?
12 2.12What is the most common reason that a variable will have a bimodal distribution?
13 2.13What is the prevalence of a disease?
14 2.14How is a percentile different from a population percentage?
15 2.15 How do the mean and median differ?
16 2.16 When are the mean and median equal?
Читать дальшеИнтервал:
Закладка:
Похожие книги на «Applied Biostatistics for the Health Sciences»
Представляем Вашему вниманию похожие книги на «Applied Biostatistics for the Health Sciences» списком для выбора. Мы отобрали схожую по названию и смыслу литературу в надежде предоставить читателям больше вариантов отыскать новые, интересные, ещё непрочитанные произведения.


Обсуждение, отзывы о книге «Applied Biostatistics for the Health Sciences» и просто собственные мнения читателей. Оставьте ваши комментарии, напишите, что Вы думаете о произведении, его смысле или главных героях. Укажите что конкретно понравилось, а что нет, и почему Вы так считаете.