Richard J. Rossi - Applied Biostatistics for the Health Sciences
Здесь есть возможность читать онлайн «Richard J. Rossi - Applied Biostatistics for the Health Sciences» — ознакомительный отрывок электронной книги совершенно бесплатно, а после прочтения отрывка купить полную версию. В некоторых случаях можно слушать аудио, скачать через торрент в формате fb2 и присутствует краткое содержание. Жанр: unrecognised, на английском языке. Описание произведения, (предисловие) а так же отзывы посетителей доступны на портале библиотеки ЛибКат.

- Название:Applied Biostatistics for the Health Sciences
- Автор:
- Жанр:
- Год:неизвестен
- ISBN:нет данных
- Рейтинг книги:3 / 5. Голосов: 1
-
Избранное:Добавить в избранное
- Отзывы:
-
Ваша оценка:
Applied Biostatistics for the Health Sciences: краткое содержание, описание и аннотация
Предлагаем к чтению аннотацию, описание, краткое содержание или предисловие (зависит от того, что написал сам автор книги «Applied Biostatistics for the Health Sciences»). Если вы не нашли необходимую информацию о книге — напишите в комментариях, мы постараемся отыскать её.
APPLIED BIOSTATISTICS FOR THE HEALTH SCIENCES Applied Biostatistics for the Health Sciences
Applied Biostatistics for the Health Sciences
Applied Biostatistics for the Health Sciences — читать онлайн ознакомительный отрывок
Ниже представлен текст книги, разбитый по страницам. Система сохранения места последней прочитанной страницы, позволяет с удобством читать онлайн бесплатно книгу «Applied Biostatistics for the Health Sciences», без необходимости каждый раз заново искать на чём Вы остановились. Поставьте закладку, и сможете в любой момент перейти на страницу, на которой закончили чтение.
Интервал:
Закладка:
NON-STANDARD NORMAL PROBABILITIES
If X is a non-standard normal variable with mean µ and standard deviation σ , then
1 P(X≥x)=1−P(X≤x) =1−P(Z≤x−μσ)
2 P(a≤X≤b)=P(X≤b)−P(X≤b) =P(Z≤b−μσ)−P(Z≤a−μσ)
Note that each of the probabilities associated with a non-standard normal distribution is based on the process of converting an x value to a z value using the formula Z=(x−μ)/σ. The reason why the standard normal can be used for computing every probability concerning a non-standard normal is that there is a one-to-one correspondence between the Z and X values (see Figure 2.29).
Example 2.38
Suppose X has a non-standard normal distribution with mean µ = 880 and standard deviation σ = 140. The probability that X is between 700 and 1000 is represented by the area shown in Figure 2.30.
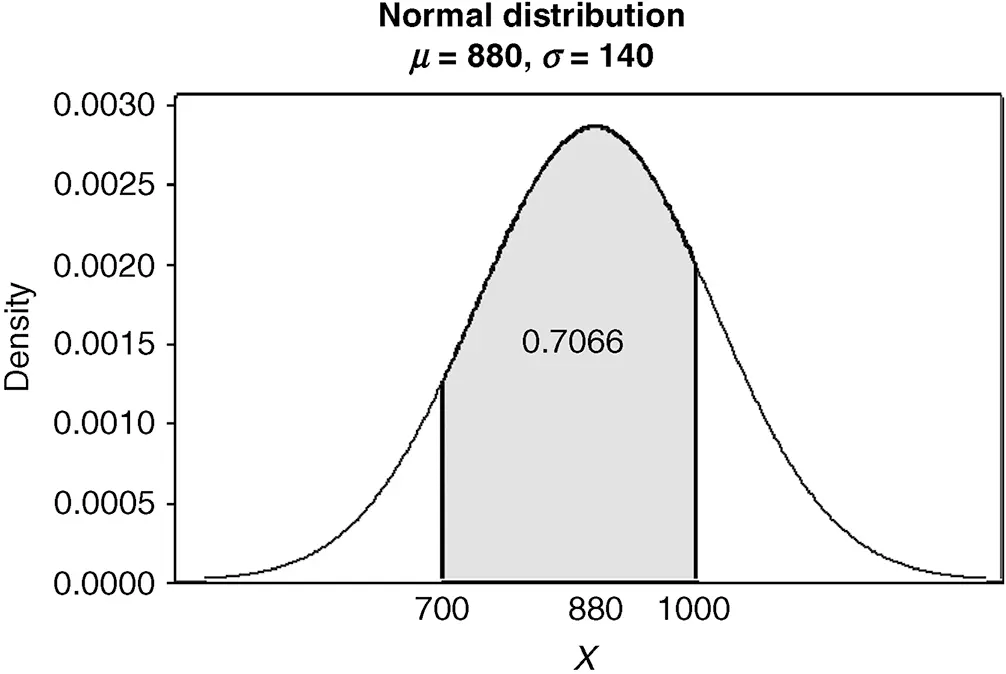
Figure 2.30 P(700≤X≤1000).
Converting the X values to Z -values leads to the corresponding probability, P(−1.29≤Z≤0.86), for the standard normal shown in Figure 2.31.
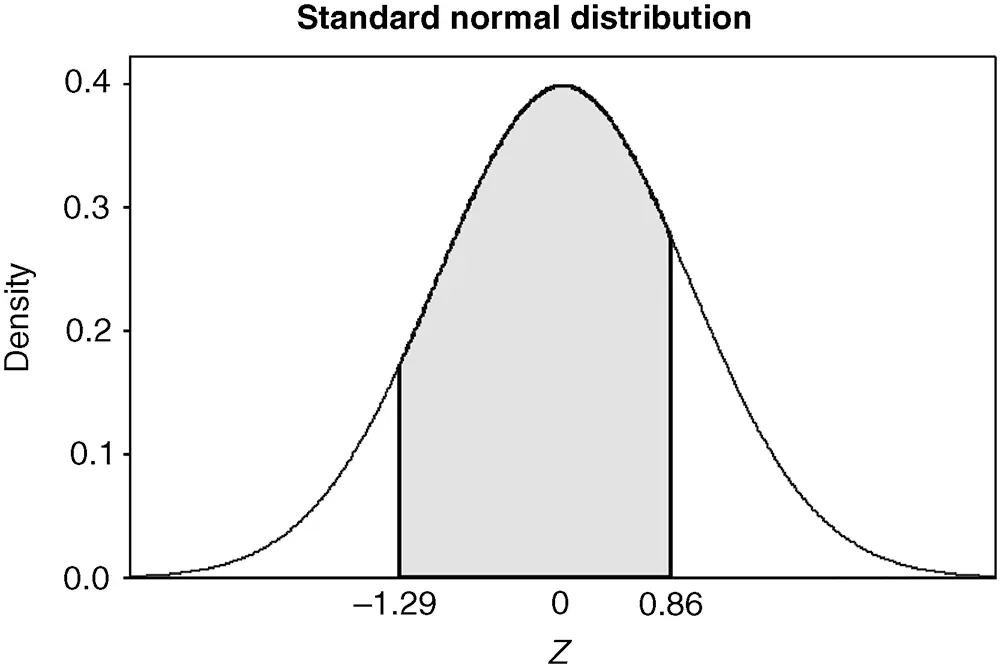
Figure 2.31 The Z region corresponding to 700≤X≤1000.
Example 2.39
The distribution of IQ scores is approximately normal with µ = 100 and σ = 15. Using this normal distribution to model the distribution of IQ scores,
1 an IQ score of 112 corresponds to a Z-value of
2 the probability of having an IQ score of 112 or less is
3 the probability of having an IQ score between 90 and 120 is
4 the probability of having an IQ score of 150 or higher is
Example 2.40
In the article “Distribution of LDL particle size in a population-based sample of children and adolescents and relationship with other cardiovascular risk factors” published in Clinical Chemistry (Stan et al., 2005), the authors reported the results of a study on the peak particle size of low-density lipoprotein (LDL) in children and adolescents. It is known that smaller more dense particles (≤255 Å) of LDL are associated with cardiovascular disease.
The distribution of peak particle was reported to be approximately normal with mean particle size µ = 262 Å and standard deviation σ = 4 Å. Based on this study, the probability that a child or adolescent will have a peak particle size of less than 255 Å is
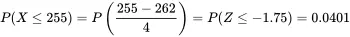
Thus, there is only a 4% chance that a child or adolescent will have peak particle size less than 255 Å.
2.4.3 Z Scores
The result of converting a non-standard normal value, a raw value , to a Z -value is a Z score . A Z score is a measure of the relative position a value has within its distribution. In particular, a Z score simply measures how many standard deviations a point is above or below the mean. When a Z score is negative the raw value lies below the mean of its distribution, and when a Z score is positive the raw value lies above the mean. Z scores are unitless measures of relative standing and provide a meaningful measure of relative standing only for mound-shaped distributions. Furthermore, Z scores can be used to compare the relative standing of individuals in two mound-shaped distributions.
Example 2.41
The weights of men and women both follow mound-shaped distributions with different means and standard deviations. In fact, the weight of a male adult in the United States is approximately normal with mean µ = 180 and standard deviation σ = 30, and the weight of a female adult in the United States is approximately normal with mean µ = 145 and standard deviation σ = 15. Given a male weighing 215 lb and a female weighing 170 lb, which individual weighs more relative to their respective population?
The answer to this question can be found by computing the Z scores associated with each of these weights to measure their relative standing. In this case,
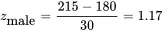
and
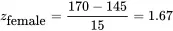
Since the female’s weight is 1.67 standard deviations from the mean weight of a female and the male’s weight is 1.17 standard deviations from the mean weight of a male, relative to their respective populations a female weighing 170 lb is heavier than a male weighing 215 lb.
Glossary
Absolute RiskThe absolute risk of a condition or disease is the probability that an individual develops the condition or disease.Binomial Probability ModelThe binomial probability model is a probability model for a discrete random variable that counts the number of successes in n independent trials of a chance experiment having only two possible outcomes.Chance ExperimentA task where the outcome cannot be predetermined is called a random experiment or a chance experiment.Conditional ProbabilityThe conditional probability of the event A given that the event B has occurred is denoted by P(A|B) and is defined as
Continuous VariableA quantitative variable is a continuous variable when the variable can take on any value in one or more intervals.Discrete VariableA quantitative variable is a discrete variable when there are either a finite or a countable number of possible values for the variable.DistributionThe distribution of a variable explicitly describes how the values of the variable are distributed in terms of percentages.EventAn event is a subcollection of the outcomes in the sample space is associated with a chance experiment.Explanatory VariableAn explanatory variable is a variable that is believed to cause changes in the response variable.Independent EventsTwo events A and B are independent when P(A|B)=P(A) or P(B|A)=P(B).Interquartile RangeThe Interquartile range of a population is the distance between the 25th and 75th percentiles and will be denoted by IQR.MeanThe mean of a variable X measured on a population consisting of N units is
MedianThe median of a population is the 50th percentile of the possible values of the variable X and will be denoted by μ~.ModeThe mode of a population is the most frequent value of the variable X in the population and will be denoted by M.Multivariate VariableA collection of variables that will be measured on each unit is called a multivariate variable.Negative Predictive ValueIn a diagnostic test, the negative predictive value (NPV) is the probability of a correct negative test result, P(−|not D).Nominal VariableA qualitative variable is called a nominal variable when the values of the variable have no intrinsic ordering.Non-standard NormalA non-standard normal is any normal distribution that does not have a standard normal distribution (i.e., either μ≠ or σ≠1).OddsThe odds of an event A is odds(A)=P(A)1−P(A).Odds RatioThe odds ratio for a disease is the ratio of the odds of the disease when the risk factor is present to the odds when the risk factor is absent.
Читать дальшеИнтервал:
Закладка:
Похожие книги на «Applied Biostatistics for the Health Sciences»
Представляем Вашему вниманию похожие книги на «Applied Biostatistics for the Health Sciences» списком для выбора. Мы отобрали схожую по названию и смыслу литературу в надежде предоставить читателям больше вариантов отыскать новые, интересные, ещё непрочитанные произведения.


Обсуждение, отзывы о книге «Applied Biostatistics for the Health Sciences» и просто собственные мнения читателей. Оставьте ваши комментарии, напишите, что Вы думаете о произведении, его смысле или главных героях. Укажите что конкретно понравилось, а что нет, и почему Вы так считаете.