Richard J. Rossi - Applied Biostatistics for the Health Sciences
Здесь есть возможность читать онлайн «Richard J. Rossi - Applied Biostatistics for the Health Sciences» — ознакомительный отрывок электронной книги совершенно бесплатно, а после прочтения отрывка купить полную версию. В некоторых случаях можно слушать аудио, скачать через торрент в формате fb2 и присутствует краткое содержание. Жанр: unrecognised, на английском языке. Описание произведения, (предисловие) а так же отзывы посетителей доступны на портале библиотеки ЛибКат.

- Название:Applied Biostatistics for the Health Sciences
- Автор:
- Жанр:
- Год:неизвестен
- ISBN:нет данных
- Рейтинг книги:3 / 5. Голосов: 1
-
Избранное:Добавить в избранное
- Отзывы:
-
Ваша оценка:
Applied Biostatistics for the Health Sciences: краткое содержание, описание и аннотация
Предлагаем к чтению аннотацию, описание, краткое содержание или предисловие (зависит от того, что написал сам автор книги «Applied Biostatistics for the Health Sciences»). Если вы не нашли необходимую информацию о книге — напишите в комментариях, мы постараемся отыскать её.
APPLIED BIOSTATISTICS FOR THE HEALTH SCIENCES Applied Biostatistics for the Health Sciences
Applied Biostatistics for the Health Sciences
Applied Biostatistics for the Health Sciences — читать онлайн ознакомительный отрывок
Ниже представлен текст книги, разбитый по страницам. Система сохранения места последней прочитанной страницы, позволяет с удобством читать онлайн бесплатно книгу «Applied Biostatistics for the Health Sciences», без необходимости каждый раз заново искать на чём Вы остановились. Поставьте закладку, и сможете в любой момент перейти на страницу, на которой закончили чтение.
Интервал:
Закладка:
Table 2.4 The Proportions of Blood Type and Rh Factor
| Blood Type | Rh Factor | |
|---|---|---|
| + | − | |
| O | 0.38 | 0.07 |
| A | 0.34 | 0.06 |
| B | 0.09 | 0.02 |
| AB | 0.03 | 0.01 |
An important proportion in many biomedical studies is the proportion of individuals having a particular disease, which is called the prevalence of the disease . The prevalence of a disease is defined to be

For example, according to the Centers for Disease Control and Prevention (CDC) the prevalence of smoking among adults in the United States in January through June 2005 was 20.9%. Proportions also play important roles in the study of survival and cure rates, the occurrence of side effects of new drugs, the absolute and relative risks associated with a disease, and the efficacy of new treatments and drugs.
A parameter that is related to a population proportion for a quantitative variable is the pth percentile of the population. The p th percentile is the value in the population where p percent of the population falls below this value. The p th percentile will be denoted by x pfor values of p between 0 and 100. Note that the percentage of the population values falling below x pis p . For example, if the 10th percentile is 2.2, then 10% of the population values fall below the value 2.2.
Percentiles can be used to describe many different characteristics of a population including the extreme values in the population, the typical values in the population, and the spread of the population. Commonly used percentiles include the
deciles that are the 10th, 20th, 30th, 40th, 50th, 60th, 70th, 80th, and 90th percentiles.
quartiles that are the 25th, 50th, and 75th percentiles.
quintiles that are the 20th, 40th, 60th, and 80th percentiles.
The 50th percentile is called the median , and the median will be denoted by μ~. The median is a measure of the typical value in the population and is a very important parameter for distributions that have long tails. The median also plays an important role in the following studies:
ID50 study that is designed to determine the median dose to infect a subject.
LD50 study that is designed to determine the median lethal dose of a toxic material.
LC50 study that is designed to determine the median lethal concentration of a toxic material.
IC50 study that is designed to determine the median inhibition value of a drug.
EC50 study that is designed to determine the median concentration of a compound required to obtain the maximum effect in vivo.
Example 2.13
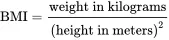
In studies investigating the prevalence of overweight and obesity among adults and children, the body mass index (BMI) is a commonly used measure of obesity. The formula for BMI is
Adults with BMI values exceeding the 85th percentile are classified as overweight. Children are classified according to the BMI breakdown given in Table 2.5.
Table 2.5 The Weight Classifications for Children Based Upon BMI
| Classification | BMI Range |
|---|---|
| Underweight | BMI < 5th percentile |
| Normal weight | 5th percentile ≤ BMI < 85th percentiles |
| At risk for overweight | 85th ≤ BMI ≤ 95th percentiles |
| Overweight | BMI > 95th percentile |
Also, according to the article “Varying body mass index cutoff points to describe overweight prevalence among U.S. adults: NHANES III (1988 to 1994)” published in the Journal of Obesity (Kuczmarski et al., 1997)
The percentage of the population with BMI < 19.0 is 1.6% for men, 5.7% for women; BMI ≥ 19.0 to < 25.0 is 39.0% for men, 43.6% for women; BMI ≥25.0 is 59.4% for men, 50.7% for women. An estimated 97.1 million adults have a BMI ≥>25.0. Additional prevalence estimates based on other BMI cutoff points and ages are presented.
A BMI calculator that computes BMI for any height and weight values and determines the percentile of the resulting BMI value can be found at the website http://www.halls.md/body-mass-index/bmi.htm.
2.2.4 Parameters Measuring Centrality
The two parameters in the population of values of a quantitative variable that summarize how the variable is distributed are the parameters that measure the typical or central values in the population and the parameters that measure the spread of the values within the population. Parameters describing the central values in a population and the spread of a population are often used for summarizing the distribution of the values in a population; however, it is important to note that most populations cannot be described very well with only the parameters that measure centrality and the spread of the population.
Measures of centrality, location, or the typical value are parameters that lie in the “center” or “middle” region of a distribution. Because the center or middle of a distribution is not easily determined due to the wide range of different shapes that are possible with a distribution, there are several different parameters that can be used to describe the center of a population. The three most commonly used parameters for describing the center of a population are the mean , median , and mode . For a quantitative variable X .
The mean of a population is the average of all of the units in the population, and will be denoted by µ. The mean of a variable X measured on a population consisting of N units is
The median of a population is the 50th percentile of the population, and will be denoted by μ~. The median of a population is found by first listing all of the values of the variable X, including repeated X values, in ascending order. When the number of units in the population (i.e., N) is an odd number, the median is the middle observation in the list of ordered values of X; when N is an even number, the median will be the average of the two observations in the middle of the ordered list of X values.
The mode of a population is the most frequent value in the population, and will be denoted by M. In a graph of the probability density function, the mode is the value of X under the peak of the graph, and a population can have more than one mode as shown in Figure 2.8.
The mean, median, and mode are three different parameters that can be used to measure the center of a population or to describe the typical values in a population. These three parameters will have nearly the same value when the distribution is symmetric or mound shaped. For long-tailed distributions, the mean, median, and mode will be different, and the difference in their values will depend on the length of the distribution’s longer tail. Figures 2.12 and 2.13 illustrate the relationships between the values of the mean, median, and mode for long-tail right and long-tail left distributions.
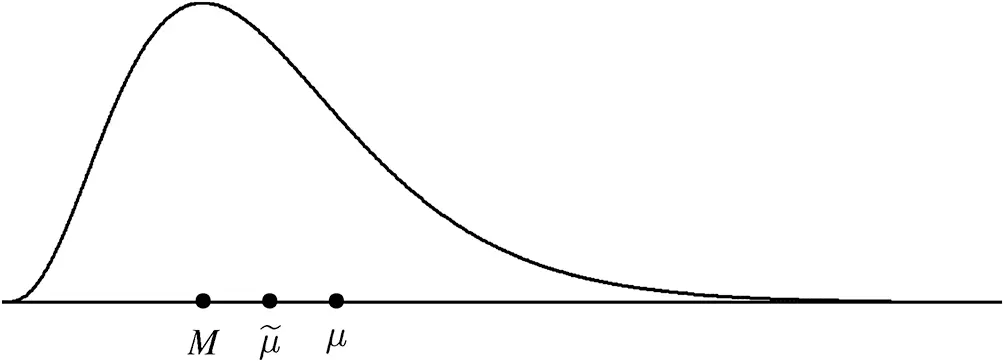
Figure 2.12 The relationships between μ,μ~, and M for a long-tail right distribution.
Читать дальшеИнтервал:
Закладка:
Похожие книги на «Applied Biostatistics for the Health Sciences»
Представляем Вашему вниманию похожие книги на «Applied Biostatistics for the Health Sciences» списком для выбора. Мы отобрали схожую по названию и смыслу литературу в надежде предоставить читателям больше вариантов отыскать новые, интересные, ещё непрочитанные произведения.


Обсуждение, отзывы о книге «Applied Biostatistics for the Health Sciences» и просто собственные мнения читателей. Оставьте ваши комментарии, напишите, что Вы думаете о произведении, его смысле или главных героях. Укажите что конкретно понравилось, а что нет, и почему Вы так считаете.