Nicolas Besson - Microsoft Windows Embedded CE 6.0 Exam Preparation Kit
Здесь есть возможность читать онлайн «Nicolas Besson - Microsoft Windows Embedded CE 6.0 Exam Preparation Kit» весь текст электронной книги совершенно бесплатно (целиком полную версию без сокращений). В некоторых случаях можно слушать аудио, скачать через торрент в формате fb2 и присутствует краткое содержание. Город: Redmond, Год выпуска: 2008, Издательство: Microsoft, Жанр: Руководства, ОС и Сети, Программы, на английском языке. Описание произведения, (предисловие) а так же отзывы посетителей доступны на портале библиотеки ЛибКат.
- Название:Microsoft Windows Embedded CE 6.0 Exam Preparation Kit
- Автор:
- Издательство:Microsoft
- Жанр:
- Год:2008
- Город:Redmond
- ISBN:нет данных
- Рейтинг книги:5 / 5. Голосов: 1
-
Избранное:Добавить в избранное
- Отзывы:
-
Ваша оценка:
Microsoft Windows Embedded CE 6.0 Exam Preparation Kit: краткое содержание, описание и аннотация
Предлагаем к чтению аннотацию, описание, краткое содержание или предисловие (зависит от того, что написал сам автор книги «Microsoft Windows Embedded CE 6.0 Exam Preparation Kit»). Если вы не нашли необходимую информацию о книге — напишите в комментариях, мы постараемся отыскать её.
Microsoft Windows Embedded CE 6.0 Exam Preparation Kit — читать онлайн бесплатно полную книгу (весь текст) целиком
Ниже представлен текст книги, разбитый по страницам. Система сохранения места последней прочитанной страницы, позволяет с удобством читать онлайн бесплатно книгу «Microsoft Windows Embedded CE 6.0 Exam Preparation Kit», без необходимости каждый раз заново искать на чём Вы остановились. Поставьте закладку, и сможете в любой момент перейти на страницу, на которой закончили чтение.
Интервал:
Закладка:
■ Sample Device Emulator eXDI 2 DriverKdStub cannot debug routines that the system runs prior to loading the kernel, nor can it debug interrupt service routines (ISRs), because this debugging library relies on software breakpoints. For hardware-assisted debugging, Platform Builder includes a sample eXDI driver that you can use in conjunction with a joint test action group (JTAG) probe. The JTAG probe enables you to set hardware breakpoints handled by the processor.
For detailed information about hardware-assisted debugging, see the section "Hardware-assisted Debugging" in the Windows Embedded CE 6.0 Documentation, available on the Microsoft MSDN Web site at http://msdn2.microsoft.com/en-us/library/aa935824.aspx.
KITL
As illustrated in Figure 4-1 at the beginning of this chapter, KITL is an essential communication layer between the development computer and the target device and must be enabled for Kernel Debugger support. As the name implies, KITL is completely hardware independent and works over network connections, serial cables, Universal Serial Bus (USB), or any other supported communication mechanism, such as Direct Memory Access (DMA). The only requirement is that both sides (development computer and target device) support and use the same interface. The most common and fastest KITL interface for the device emulator is DMA, as illustrated in Figure 4-7. For target devices with a supported Ethernet chip, it is typically best to use the network interface.
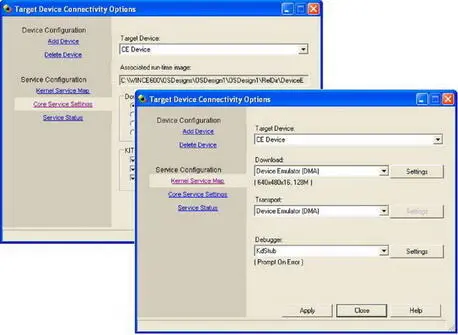
Figure 4-7Configuring the KITL communication interface
KITL supports the following two methods of operation:
■ Active modeBy default, Platform Builder configures KITL to connect to the development computer during the start process. This setting is most useful for kernel and application debugging during the software-development cycle.
■ Passive modeBy clearing the check box Enable KITL on Device Boot, you can configure KITL for passive mode, meaning Windows Embedded CE initializes the KITL interface, but KITL does not establish a connection during the startup process. If an exception occurs, KITL makes an attempt to establish a connection to the development computer so that you can perform JIT debugging. Passive mode is most useful when working with mobile devices that do not have a physical connection to the development computer at startup.
The Enable KITL on Device Boot setting is a boot argument (BootArgs) that Platform Builder configures for the boot loader. For more information about boot loaders and their advantages during the BSP development process, see the section "Boot Loaders" in the Windows Embedded CE 6.0 Documentation, available on the Microsoft MSDN Web site at http://msdn2.microsoft.com/en-us/library/aa917791.aspx.
Debugging a Target Device
It is important to keep in mind that development-side and target-side debugger components run independently of each other. For example, it is possible to run the Kernel Debugger in Visual Studio 2005 with Platform Builder without having an active target device. If you open the Debug menu and click Start or press the F5 key, the Kernel Debugger starts and informs you in the Output window that it is waiting for a connection to the target device. On the other hand, if you start a debugging- enabled run-time image without an active KITL connection to a debugger and an exception occurs, the run-time image appears to hang because the system halts, waiting for control requests from the debugger, as mentioned earlier in this chapter. For this reason, the debugger typically starts automatically when you attach to a debugging-enabled target device. Instead of pressing F5 to start a debugging session, use Attach Device on the Target menu.
Enabling and Managing Breakpoints
The debugging features of Platform Builder provide most of the functionality also found in other debuggers for Windows desktop applications. You can set breakpoints, step through the code line-by-line, and use the Watch window to view and change variable values and object properties, as illustrated in Figure 4-8. Keep in mind, however, that the ability to use breakpoints depends on the existence of the KdStub library in the run-time image.
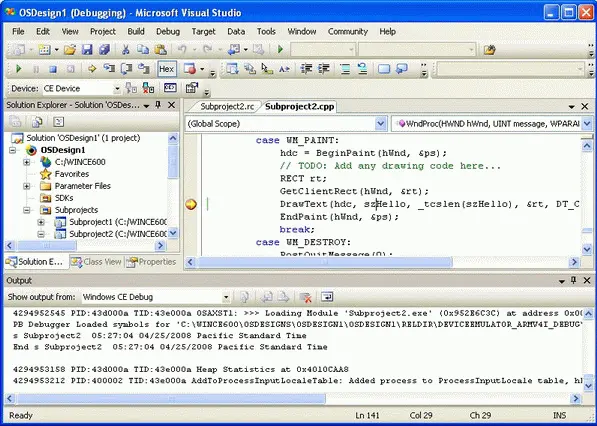
Figure 4-8Debugging a Hello World application
To set a breakpoint, use the Toggle Breakpoint option on the Debug menu in Visual Studio. Alternatively, you can press F9 to set a breakpoint at the current line or click the left margin area of the code line. According to your selection, Platform Builder indicates the breakpoint with a red dot or a red circle, depending on whether the debugger can instantiate the breakpoint or not. The red circle indicates an un-instantiated breakpoint. Un-instantiated breakpoints occur if the Visual Studio instance is not linked to the target code, the breakpoint is set but has not yet been loaded, the debugger is not enabled, or if the debugger is running but code execution has not yet halted. If you set a breakpoint while the debugger is running, then the device must break into the debugger first before the debugger can instantiate the breakpoint.
You have the following options to manage breakpoints in Visual Studio with Platform Builder:
■ Source code, Call Stack, and Disassembly windowsYou can set, remove, enable, or disable a breakpoint by either pressing F9 and selecting Toggle
Breakpoint from the Debug menu or selecting Insert/Remove Breakpoint from the context menu.
■ New Breakpoint dialog boxYou can display this dialog box via the submenus available under New Breakpoint on the Debug menu. The New Breakpoint dialog box enables you to set breakpoints by location and conditions. The debugger stops at a conditional breakpoint only if the specified condition evaluates to TRUE, such as when a loop counter or other variable has a specific value.
■ Breakpoints windowYou can display the Breakpoints window by clicking Breakpoints under the Windows submenu on the Debug menu, or by pressing Alt+F9. The Breakpoints window lists all set breakpoints and enables you to configure breakpoint properties. For example, instead of using the New Breakpoint dialog box, which requires you to specify location information manually, you can set the desired breakpoint directly in the source code and then display the properties of this breakpoint in the Breakpoints window to define conditional parameters.
Use breakpoints sparingly. Setting too many breakpoints and constantly selecting Resume impacts debugging efficiency and makes it hard to focus on one aspect of the system at a time. Consider disabling and re-enabling breakpoints as necessary.
Breakpoint Restrictions
When configuring the properties of a breakpoint in the New Breakpoint dialog box or the Breakpoints window, you may notice a Hardware button, which you can use to configure the breakpoint as a hardware breakpoint or software breakpoint. You cannot use software breakpoints in OAL code or interrupt handlers, because the breakpoint must not completely halt the execution of the system. Among other system processes, the KITL connection must remain active, because it is the only way to communicate with the debugger on the development workstation. KITL interfaces with the OAL and uses the kernel's interrupt-based communication mechanisms. If you set a breakpoint in an interrupt handler function, then the system will not be able to communicate any longer when the breakpoint is reached because interrupt handling is a single-threaded and non-interruptible function.
Читать дальшеИнтервал:
Закладка:
Похожие книги на «Microsoft Windows Embedded CE 6.0 Exam Preparation Kit»
Представляем Вашему вниманию похожие книги на «Microsoft Windows Embedded CE 6.0 Exam Preparation Kit» списком для выбора. Мы отобрали схожую по названию и смыслу литературу в надежде предоставить читателям больше вариантов отыскать новые, интересные, ещё непрочитанные произведения.


Обсуждение, отзывы о книге «Microsoft Windows Embedded CE 6.0 Exam Preparation Kit» и просто собственные мнения читателей. Оставьте ваши комментарии, напишите, что Вы думаете о произведении, его смысле или главных героях. Укажите что конкретно понравилось, а что нет, и почему Вы так считаете.