Nicolas Besson - Microsoft Windows Embedded CE 6.0 Exam Preparation Kit
Здесь есть возможность читать онлайн «Nicolas Besson - Microsoft Windows Embedded CE 6.0 Exam Preparation Kit» весь текст электронной книги совершенно бесплатно (целиком полную версию без сокращений). В некоторых случаях можно слушать аудио, скачать через торрент в формате fb2 и присутствует краткое содержание. Город: Redmond, Год выпуска: 2008, Издательство: Microsoft, Жанр: Руководства, ОС и Сети, Программы, на английском языке. Описание произведения, (предисловие) а так же отзывы посетителей доступны на портале библиотеки ЛибКат.
- Название:Microsoft Windows Embedded CE 6.0 Exam Preparation Kit
- Автор:
- Издательство:Microsoft
- Жанр:
- Год:2008
- Город:Redmond
- ISBN:нет данных
- Рейтинг книги:5 / 5. Голосов: 1
-
Избранное:Добавить в избранное
- Отзывы:
-
Ваша оценка:
Microsoft Windows Embedded CE 6.0 Exam Preparation Kit: краткое содержание, описание и аннотация
Предлагаем к чтению аннотацию, описание, краткое содержание или предисловие (зависит от того, что написал сам автор книги «Microsoft Windows Embedded CE 6.0 Exam Preparation Kit»). Если вы не нашли необходимую информацию о книге — напишите в комментариях, мы постараемся отыскать её.
Microsoft Windows Embedded CE 6.0 Exam Preparation Kit — читать онлайн бесплатно полную книгу (весь текст) целиком
Ниже представлен текст книги, разбитый по страницам. Система сохранения места последней прочитанной страницы, позволяет с удобством читать онлайн бесплатно книгу «Microsoft Windows Embedded CE 6.0 Exam Preparation Kit», без необходимости каждый раз заново искать на чём Вы остановились. Поставьте закладку, и сможете в любой момент перейти на страницу, на которой закончили чтение.
Интервал:
Закладка:
Table 4-3 illustrates the configuration for a sample module called ModuleName . Make sure you replace this placeholder name with the actual name of your executable file or DLL.
Table 4-3 Startup registry parameter examples
| Location | Development Workstation | Target Device |
|---|---|---|
| Registry Key | HKEY_CURRENT_USER\Pegasus\Zones | HKEY_LOCAL_MACHINE\DebugZones |
| Entry Name | ModuleName | ModuleName |
| Type | REG_DWORD | REG_DWORD |
| Value | 0x00000001-0x7FFFFFFF | 0x00000001-0x7FFFFFFF |
| Comments | The Debug Message system uses the target-side value for a module only if the development workstation is unavailable or if the development-side registry does not contain a value for the module. |
Windows Embedded CE uses the lower 16 bits of the REG_DWORD value to define named debug zones for application debugging purposes. The remaining bits are available to define unnamed debug zones, with the exception of the highest bit, which is reserved for the kernel. Therefore, you should not set a module's debug zone value to 0xFFFFFFFF. The maximum value is 0x7FFFFFFF, which enables all named and unnamed debug zones.
The name Pegasus refers to the code name of the first Windows CE version that Microsoft released for handheld personal computers and other consumer electronics in 1996.
Best Practices
When working with debug messages, keep in mind that heavy use of debug messages slows down code execution. Perhaps even more important, the system serializes the debug output operations, which can provide an unintentional thread synchronization mechanism. For example, multiple threads running unsynchronized in release builds might cause issues not noticeable in debug builds.
When working with debug messages and debug zones, consider the following best practices:
■ Use Conditional statementsUse debug macros with conditional statements based on debug zones. Do not use DEBUGMSG(TRUE). Also avoid using retail macros without conditional statements, such as RETAILMSG(TRUE), although some model device driver (MDD)/platform dependent driver (PDD) drivers must use this technique.
■ Exclude debugging code from release buildsIf you only use debug zones in debug builds, include the global variable dpCurSettings and zone mask definitions in #ifdef DEBUG #endif guards and restrict the use of debug zones to debug macros (such as DEBUGMSG).
■ Use retail macros in release buildsIf you also want to use debug zones in release builds, include the global variable dpCurSettings and zone mask definitions in #ifndef SHIP_BUILD #endif guards and replace the call to DEBUGREGISTER with a call to RETAILREGISTERZONES.
■ Clearly identify the module nameIf possible, set the dpCurSettings.lpszName value to the module's file name.
■ Limit verbosity by defaultSet the default zones for your drivers to ZONE_ERROR and ZONE_WARNING only. When bringing up a new platform, enable ZONE_INIT.
■ Restrict the error debug zone to unrecoverable issuesUse ZONE_ERROR only when your module or significant functionality fails due to incorrect configuration or other issues. Use ZONE_WARNING for recoverable issues.
■ Eliminate all errors and warnings if possibleYour module should be able to load without any ZONE_ERROR or ZONE_WARNING messages.
Target Control Commands
The Target Control service provides access to a command shell for the debugger to transfer files to the target device and debug applications. This target control shell, displayed in Figure 4-3, is accessible from within Visual Studio with Platform Builder via the Target Control option on the Target menu. However, it is important to keep in mind that the target control shell is only available if the Platform Builder instance is attached to a device through KITL.
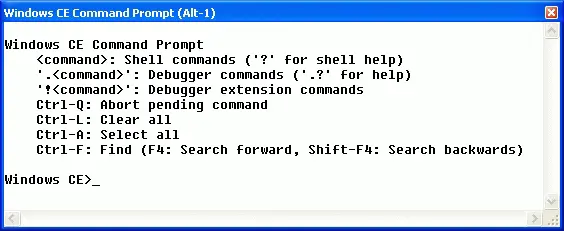
Figure 4-3The target control shell
Among other things, the target control shell enables you to perform the following debugging actions:
■ Break into the Kernel Debugger ( breakcommand).
■ Send a memory dump to the debug output ( ddcommand) or to a file ( dfcommand).
■ Analyze memory usage for the kernel ( mi kernelcommand) or the entire system ( mi fullcommand).
■ List processes ( gi proccommand), threads ( gi thrdcommand), and thread priorities ( tpcommand), as well as the modules loaded on the system ( gi modcommand).
■ Launch processes ( scommand) and end processes ( kpcommand).
■ Dump the processes heap ( hpcommand).
■ Enable or disable the system profiler ( profcommand).
For a complete list of target control commands, see the section "Target Control Debugging Commands" in the Windows Embedded CE 6.0 Documentation, available on the Microsoft MSDN® Web site at http://msdn2.microsoft.com/en-us/library/aa936032.aspx.
Debugger Extension Commands (CEDebugX)
In addition to the regular debugger commands, the Target Control service provides the debugger with a debugger commands extension (CEDebugX) to increase the efficiency of kernel and application debugging. This extension provides additional features to detect memory leaks and deadlocks and diagnose the overall health of the system. The additional commands are accessible through the target control shell and start with an exclamation point (!).
To use CEDebugX, you need to break into the Kernel Debugger by using the breakcommand in the target control shell or the Break All command on the Target menu in Visual Studio. Among other things, you can then enter a !diagnose allcommand to identify the potential reason for a failure, such as heap corruption, deadlocks, or memory starvation. On a healthy system, the CEDebugX should detect no any issues, as illustrated in Figure 4-4.
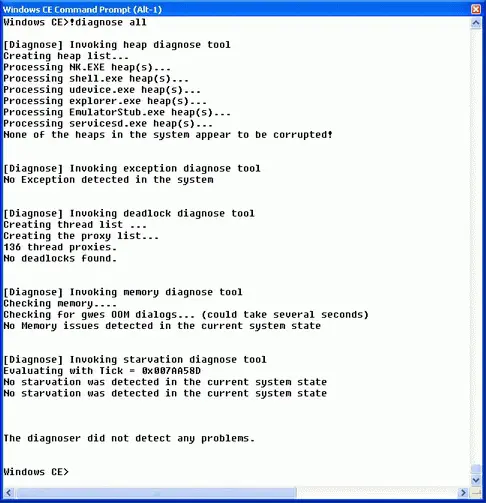
Figure 4-4Diagnosing a run-time image with CEDebugX
The !diagnose allcommand runs the following diagnostics:
■ HeapDiagnoses all the heap objects of all processes on the system to identify potential content corruption.
■ ExceptionDiagnoses an exception that occurs on the system and is able to provide details on the exception, such as process and thread ID, and PC address at the exception time.
■ MemoryDiagnoses the system memory to identify potential memory corruptions and low memory conditions.
■ DeadlockDiagnoses the thread states and system objects (see Chapter 3 for more details on thread synchronization). It can provide a list of system objects and thread IDs that generated the deadlock.
■ StarvationDiagnoses threads and system objects to identify potential thread starvation. Starvation occurs when a thread is never scheduled on the system by the scheduler because the scheduler is busy with higher-priority threads.
Читать дальшеИнтервал:
Закладка:
Похожие книги на «Microsoft Windows Embedded CE 6.0 Exam Preparation Kit»
Представляем Вашему вниманию похожие книги на «Microsoft Windows Embedded CE 6.0 Exam Preparation Kit» списком для выбора. Мы отобрали схожую по названию и смыслу литературу в надежде предоставить читателям больше вариантов отыскать новые, интересные, ещё непрочитанные произведения.


Обсуждение, отзывы о книге «Microsoft Windows Embedded CE 6.0 Exam Preparation Kit» и просто собственные мнения читателей. Оставьте ваши комментарии, напишите, что Вы думаете о произведении, его смысле или главных героях. Укажите что конкретно понравилось, а что нет, и почему Вы так считаете.