Nicolas Besson - Microsoft Windows Embedded CE 6.0 Exam Preparation Kit
Здесь есть возможность читать онлайн «Nicolas Besson - Microsoft Windows Embedded CE 6.0 Exam Preparation Kit» весь текст электронной книги совершенно бесплатно (целиком полную версию без сокращений). В некоторых случаях можно слушать аудио, скачать через торрент в формате fb2 и присутствует краткое содержание. Город: Redmond, Год выпуска: 2008, Издательство: Microsoft, Жанр: Руководства, ОС и Сети, Программы, на английском языке. Описание произведения, (предисловие) а так же отзывы посетителей доступны на портале библиотеки ЛибКат.
- Название:Microsoft Windows Embedded CE 6.0 Exam Preparation Kit
- Автор:
- Издательство:Microsoft
- Жанр:
- Год:2008
- Город:Redmond
- ISBN:нет данных
- Рейтинг книги:5 / 5. Голосов: 1
-
Избранное:Добавить в избранное
- Отзывы:
-
Ваша оценка:
Microsoft Windows Embedded CE 6.0 Exam Preparation Kit: краткое содержание, описание и аннотация
Предлагаем к чтению аннотацию, описание, краткое содержание или предисловие (зависит от того, что написал сам автор книги «Microsoft Windows Embedded CE 6.0 Exam Preparation Kit»). Если вы не нашли необходимую информацию о книге — напишите в комментариях, мы постараемся отыскать её.
Microsoft Windows Embedded CE 6.0 Exam Preparation Kit — читать онлайн бесплатно полную книгу (весь текст) целиком
Ниже представлен текст книги, разбитый по страницам. Система сохранения места последней прочитанной страницы, позволяет с удобством читать онлайн бесплатно книгу «Microsoft Windows Embedded CE 6.0 Exam Preparation Kit», без необходимости каждый раз заново искать на чём Вы остановились. Поставьте закладку, и сможете в любой момент перейти на страницу, на которой закончили чтение.
Интервал:
Закладка:
Advanced Debugger Tools
The target control shell and CEDebugX commands enable you to perform a thorough analysis of a running system or a CE dump file (if you select the CE Dump File Reader as the debugger to perform postmortem debugging), yet you are not restricted to the command-line interface. Platform Builder includes several graphical tools with a dedicated purpose to increase your debugging efficiency. You can access these advanced debugger tools in Visual Studio via the Debug menu when you open the Windows submenu.
The Platform Builder IDE includes the following advanced debugger tools:
■ BreakpointsLists the breakpoints enabled on the system and provides access to the breakpoint properties.
■ WatchProvides read and write access to local and global variables.
■ AutosProvides access to variables similar to the Watch window, except that the debugger creates this list of variables dynamically, while the Watch window lists all manually added variables whether they are accessible or not. The Autos window is useful if you want to check the parameter values passed to a function.
■ Call StackAccessible only when the system is in a break state (code execution has halted on a breakpoint). This window provides a list of all processes enabled on the system and a list of hosted threads.
■ ThreadsProvides a list of the threads running in the processes on the system. This information is dynamically retrieved and can be updated at any time.
■ ModulesLists the modules loaded and unloaded on the system and provides the memory address where those modules are loaded. This feature is useful for identifying whether a driver DLL is actually loaded or not.
■ ProcessesSimilar to the Threads window, this window provides a list of the processes running on the system. Among other things, you can terminate processes if required.
■ MemoryProvides direct access to device memory. You can use memory addresses or variable names to locate the desired memory content.
■ DisassemblyReveals the assembly code of the current code line executed on the system.
■ RegistersProvides access to the CPU register values when running a specific line of code.
■ Advanced MemoryCan be used to search the device memory, move portions of memory to different sections, and fill memory ranges by using content patterns.
■ List Nearest SymbolsDetermines a specific memory address for the nearest symbols available in the binaries. It also provides the complete path to the file containing the symbol. This tool is useful to locate the name of a function that generated an exception.
The Memory and Advanced Memory tools can modify memory content. Using these tools incorrectly can cause system failures and damage the operating system on the target device.
Application Verifier Tool
Another useful tool to identify potential application compatibility and stability issues and necessary source code-level fixes is the Application Verifier tool, included in the CETK. This tool can attach to an application or a DLL to diagnose problems that are otherwise difficult to track on standalone devices. The Application Verifier tool does not require a device connection to a development workstation and can be launched at system startup to check and validate drivers and system applications. You can also start this tool from the CETK user interface or manually on the target device. If you want to use the Application Verifier tool outside of the CETK, you should use the Getappverif_cetk.bat file to copy all the required files into the release directory.
For detailed information about the Application Verifier tool, including how to use shim extension DLLs to run custom test code or change the behavior of functions during application testing, see the section "Application Verifier Tool" in the Windows Embedded CE 6.0 Documentation, available on the Microsoft MSDN Web site at http://msdn2.microsoft.com/en-us/library/aa934321.aspx.
CeLog Event Tracking and Processing
Windows Embedded CE includes an extensible event-tracking system that you can include in a run-time image to diagnose performance problems. The CeLog event-tracking system logs a set of predefined kernel and coredll events related to mutexes, events, memory allocation, and other kernel objects. The extensible architecture of the CeLog event-tracking system also enables you to implement custom filters to track user-defined events. For platforms connected to a development workstation through KITL, the CeLog event-tracking system can selectively log events based on zones specified in the ZoneCE registry entry, as summarized in Table 4-4.
Table 4-4 CeLog registry parameters for event logging zones
| Location | HKEY_LOCAL_MACHINE\System\CELog |
|---|---|
| Registry Entry | ZoneCE |
| Entry Type | REG_DWORD |
| Value | < Zone IDs > |
| Description | By default, all zones are logged. For a list of all possible zone ID values, see the section "CELog Zones" in the Windows Embedded CE 6.0 Documentation, available on the Microsoft MSDN Web site at http://msdn2.microsoft.com/en-us/library/aa909194.aspx . |
By using the CeLog event-tracking system, you can collect data, which CeLog stores in a buffer in RAM on the target device. Performance tools, such as Remote Kernel Tracker and Readlog, can then process the collected data. It is also possible to flush the data periodically to a file by using the CELogFlush tool.
You should not include the CeLog event-tracking system in final builds to avoid performance and memory penalties due to CeLog activities, and to reduce the attack surface through which a malicious user could try to compromise the system.
Remote Kernel Tracker
The Remote Kernel Tracker tool enables you to monitor system activities on a target device based on processes and threads. This tool can display information from the target device in real time through KITL, yet it is also possible to use Remote Kernel Tracker offline based on CeLog data files. You can find more information about the Remote Kernel Tracker tool in Chapter 3, "Performing System Programming."
Figure 4-5 shows Kernel Tracker on a target device collecting information about thread activities.
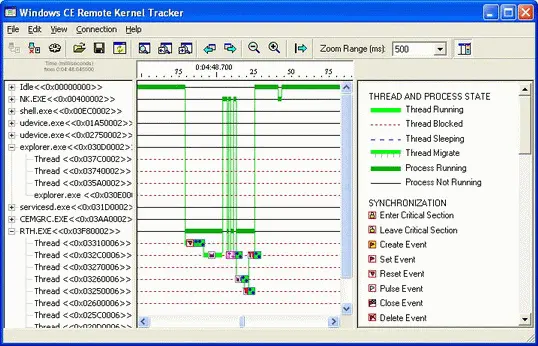
Figure 4-5Thread information in Kernel Tracker
CeLogFlush Tool
To create CeLog data files, use the CeLogFlush tool to save the CeLog event data buffered in RAM into a .clg file. This file can be located in the RAM file system, persistent storage, or the release file system on a development workstation. To minimize data loss due to buffer overruns, you can specify a larger RAM buffer and increase the frequency at which CeLog flushes the buffer. You can optimize the performance if you keep the file open to avoid repeated file open and close operations and store the file in the RAM file system instead of a slower persistent storage medium.
For detailed information about the CeLogFlush tool, including how to configure this tool through registry settings, see the section "CeLogFlush Registry Settings" in the Windows Embedded CE 6.0 Documentation, available on the Microsoft MSDN Web site at http://msdn2.microsoft.com/en-us/library/aa935267.aspx.
Читать дальшеИнтервал:
Закладка:
Похожие книги на «Microsoft Windows Embedded CE 6.0 Exam Preparation Kit»
Представляем Вашему вниманию похожие книги на «Microsoft Windows Embedded CE 6.0 Exam Preparation Kit» списком для выбора. Мы отобрали схожую по названию и смыслу литературу в надежде предоставить читателям больше вариантов отыскать новые, интересные, ещё непрочитанные произведения.


Обсуждение, отзывы о книге «Microsoft Windows Embedded CE 6.0 Exam Preparation Kit» и просто собственные мнения читателей. Оставьте ваши комментарии, напишите, что Вы думаете о произведении, его смысле или главных героях. Укажите что конкретно понравилось, а что нет, и почему Вы так считаете.