Nicolas Besson - Microsoft Windows Embedded CE 6.0 Exam Preparation Kit
Здесь есть возможность читать онлайн «Nicolas Besson - Microsoft Windows Embedded CE 6.0 Exam Preparation Kit» весь текст электронной книги совершенно бесплатно (целиком полную версию без сокращений). В некоторых случаях можно слушать аудио, скачать через торрент в формате fb2 и присутствует краткое содержание. Город: Redmond, Год выпуска: 2008, Издательство: Microsoft, Жанр: Руководства, ОС и Сети, Программы, на английском языке. Описание произведения, (предисловие) а так же отзывы посетителей доступны на портале библиотеки ЛибКат.
- Название:Microsoft Windows Embedded CE 6.0 Exam Preparation Kit
- Автор:
- Издательство:Microsoft
- Жанр:
- Год:2008
- Город:Redmond
- ISBN:нет данных
- Рейтинг книги:5 / 5. Голосов: 1
-
Избранное:Добавить в избранное
- Отзывы:
-
Ваша оценка:
Microsoft Windows Embedded CE 6.0 Exam Preparation Kit: краткое содержание, описание и аннотация
Предлагаем к чтению аннотацию, описание, краткое содержание или предисловие (зависит от того, что написал сам автор книги «Microsoft Windows Embedded CE 6.0 Exam Preparation Kit»). Если вы не нашли необходимую информацию о книге — напишите в комментариях, мы постараемся отыскать её.
Microsoft Windows Embedded CE 6.0 Exam Preparation Kit — читать онлайн бесплатно полную книгу (весь текст) целиком
Ниже представлен текст книги, разбитый по страницам. Система сохранения места последней прочитанной страницы, позволяет с удобством читать онлайн бесплатно книгу «Microsoft Windows Embedded CE 6.0 Exam Preparation Kit», без необходимости каждый раз заново искать на чём Вы остановились. Поставьте закладку, и сможете в любой момент перейти на страницу, на которой закончили чтение.
Интервал:
Закладка:
Readlog Tool
In addition to the graphical Remote Kernel Tracker application, you can process CELog data files by using the Readlog tool, located in the %_WINCEROOT%\Public\Common\Oak\Bin\i386 folder. Readlog is a command-line tool to process and display information not exposed in Remote Kernel Tracker, such as debug messages and boot events. It is often useful to analyze system activities in Remote Kernel Tracker first and then focus on an identified process or thread with the Readlog tool. The raw data that the CeLogFlush tool writes into the .clg file is ordered by zones to facilitate locating and extracting specific information. You can also filter the data and extend filtering capabilities based on extension DLLs to process custom data captured through the custom events collector.
One of the most useful Readlog scenarios is to replace thread start addresses (the functions passed to the CreateThread call) in CeLog data files with the names of the actual thread functions to facilitate system analysis in Remote Kernel Tracker. To accomplish this task, you must start Readlog with the -fixthreadsparameter ( readlog -fixthreads). Readlog looks up the symbol .map files in the release directory to identify the thread functions based on the start addresses and generates new logs with the corresponding references.
Figure 4-6 shows CeLog data in Remote Kernel Tracker, captured through the CeLog event-tracking system, flushed to a .clg file with the CeLogFlush tool, and prepared for a more user-friendly display of the information by using the Readlog application with the -fixthreadsparameter.
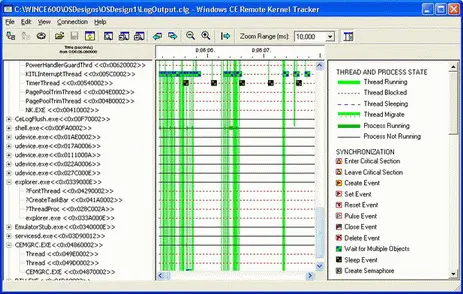
Figure 4-6A CeLog data file prepared with readlog -fixthreadsand opened in Remote Kernel Tracker
The CeLog event-tracking system can take advantage of the kernel profiler to look up thread function names based on start addresses when capturing CreateThread events, if you explicitly enable the kernel profiler and add profiling symbols to the run-time image by rebuilding the image with the IMGPROFILER environment variable set. However, CeLog can only look up the profiling symbols built into the run-time image. Symbols of applications developed based on a Software Development Kit (SDK) are generally unavailable to the CeLog event-tracking system.
Lesson Summary
Debugging an operating system and applications requires familiarity with both the CE system and the debugging tools included in Platform Builder and CETK. The most important debugging tools are the system debugger, debug message feature, and CE target control shell. The system debugger enables you to set breakpoints and step through kernel and application code, while the debug message feature provides the option to analyze system components and applications without interrupting code execution. A variety of debug and retail macros are available to output debugging information from target devices with or without a display component. Because systems and applications can potentially generate a large number of debug messages, you should use debug zones to control the output of debugging information. The key advantage of debug zones is that you can change the debug information verbosity dynamically without having to rebuild the run-time image. The target control shell, on the other hand, enables you to send commands to the target device, such as a breakcommand followed by a !diagnose allcommand to break into the debugger and perform a CEDebugX check on the overall system health, including memory leaks, exceptions, and deadlocks.
Apart from these core debugging tools, you can use typical CE configuration and troubleshooting tools, such as the Application Verifier tool, to identify potential application compatibility and stability issues, and Remote Kernel Tracker to analyze processes, threads, and system performance. Remote Kernel Tracker relies on the CeLog event-tracking system, which typically maintains logged data in memory on the target device; you can also flush this data to a file by using the CeLogFlush tool. If symbol files are available for the modules that you want to analyze, you can use the Readlog tool to replace the thread start addresses with the actual function names and generate new CeLog data files for more convenient offline analysis in Remote Kernel Tracker.
Lesson 2: Configuring the Run-Time Image to Enable Debugging
The debugging features of Windows Embedded CE rely on development workstation components and the target device, and require specific settings and hardware support. Without a connection between the development workstation and the target device, debug information and other requests cannot be exchanged. If this communication link breaks — for example, because you stop the debugger on the development workstation without first unloading the target-side debugging stub — the run-time image might stop responding to user input while waiting for the debugger to resume code execution after an exception occurred.
After this lesson, you will be able to:
■ Enable the Kernel Debugger for a run-time image.
■ Identify the KITL requirements.
■ Use the Kernel Debugger in a debugging context.
Estimated lesson time: 20 minutes.
Enabling the Kernel Debugger
As discussed in Lesson 1, the development environment for Windows Embedded CE 6.0 includes a Kernel Debugger that enables developers to step through and interact with code running on a CE target device. This debugger requires you to set kernel options and a communication layer between the target device and the development computer.
OS Design Settings
To enable an OS design for debugging, you must unset the environment variables IMGNODEBUGGER and IMGNOKITL so that Platform Builder includes the KdStub library and enables the KITL communication layer in the Board Support Package (BSP) when building the run-time image. Platform Builder provides a convenient method to accomplish this task. In Visual Studio, right-click the OS design project and select Properties to display the OS Design property pages dialog box, switch to the Build Options pane, and then select the Enable Kernel Debugger and Enable KITL check boxes. Chapter 1, "Customizing the Operating System Design," discusses the OS Design property pages dialog box in more detail.
Selecting a Debugger
Having enabled KdStub and KITL for a run-time image, you can select a debugger to analyze the system on the target device in the communication parameters for your target device. To configure these parameters, display the Target Device Connectivity Options dialog box in Visual Studio by opening the Target menu and selecting Connectivity Options, as explained in Chapter 2, "Building and Deploying a RunTime Image."
By default, no debugger is selected in the connectivity options. You have the following debugger choices:
■ KdStubThis is the software debugger for the kernel and applications to debug system components, drivers, and applications running on a target device. KdStub requires KITL to communicate with Platform Builder.
■ CE Dump File ReaderPlatform Builder provides you with an option to capture dump files, which you can then open by using the CE dump-file reader. Dump files enable you to study the state of a system at a particular point in time and are useful as references.
Читать дальшеИнтервал:
Закладка:
Похожие книги на «Microsoft Windows Embedded CE 6.0 Exam Preparation Kit»
Представляем Вашему вниманию похожие книги на «Microsoft Windows Embedded CE 6.0 Exam Preparation Kit» списком для выбора. Мы отобрали схожую по названию и смыслу литературу в надежде предоставить читателям больше вариантов отыскать новые, интересные, ещё непрочитанные произведения.


Обсуждение, отзывы о книге «Microsoft Windows Embedded CE 6.0 Exam Preparation Kit» и просто собственные мнения читателей. Оставьте ваши комментарии, напишите, что Вы думаете о произведении, его смысле или главных героях. Укажите что конкретно понравилось, а что нет, и почему Вы так считаете.