Dr. Pass - Economics
Здесь есть возможность читать онлайн «Dr. Pass - Economics» — ознакомительный отрывок электронной книги совершенно бесплатно, а после прочтения отрывка купить полную версию. В некоторых случаях можно слушать аудио, скачать через торрент в формате fb2 и присутствует краткое содержание. Жанр: unrecognised, на английском языке. Описание произведения, (предисловие) а так же отзывы посетителей доступны на портале библиотеки ЛибКат.
- Название:Economics
- Автор:
- Жанр:
- Год:неизвестен
- ISBN:нет данных
- Рейтинг книги:4 / 5. Голосов: 1
-
Избранное:Добавить в избранное
- Отзывы:
-
Ваша оценка:
Economics: краткое содержание, описание и аннотация
Предлагаем к чтению аннотацию, описание, краткое содержание или предисловие (зависит от того, что написал сам автор книги «Economics»). Если вы не нашли необходимую информацию о книге — напишите в комментариях, мы постараемся отыскать её.
Economics — читать онлайн ознакомительный отрывок
Ниже представлен текст книги, разбитый по страницам. Система сохранения места последней прочитанной страницы, позволяет с удобством читать онлайн бесплатно книгу «Economics», без необходимости каждый раз заново искать на чём Вы остановились. Поставьте закладку, и сможете в любой момент перейти на страницу, на которой закончили чтение.
Интервал:
Закладка:
Fig. 40 Demand curve (shift in).An increase in income shifts the demand curve D 1D 1to D 2D 2, increasing the quantity demanded from OQ 1, to OQ 2. The magnitude of this shift depends upon the INCOME ELASTICITY OF DEMAND for the product.
demand depositsee BANK DEPOSIT, COMMERCIAL BANK.
demand elasticitysee ELASTICITY OF DEMAND.
demand for a factor inputsee DERIVED DEMAND.
demand functiona form of notation that links the DEPENDENT VARIABLE, quantity demanded (Qd), with various INDEPENDENT VARIABLES that determine quantity demanded such as product price (P), income (Y), prices of substitute products (Ps), advertising (A), etc.:
Qd = f (P, Y, Ps, A, etc)
Changes in any of these independent variables will affect quantity demanded, and if we wish to investigate the particular effect of any one of these variables upon quantity demanded, then we could (conceptually) hold the influence of the other independent variables constant (CETERIS PARIBUS), whilst we focus upon the particular effects of that independent variable. See DEMAND CURVE, DEMAND CURVE (SHIFT IN).
demand management or stabilization policy
The control of the level of AGGREGATE DEMAND in an economy, using FISCAL POLICY and MONETARY POLICY to moderate or eliminate fluctuations in the level of economic activity associated with the BUSINESS CYCLE. The general objective of demand management is to ‘fine-tune’ aggregate demand so that it is neither deficient relative to POTENTIAL GROSS NATIONAL PRODUCT (thereby avoiding a loss of output and UNEMPLOYMENT) nor overfull (thereby avoiding INFLATION).
An unregulated economy will tend to go through periods of depression and boom as indicated by the continuous line in Fig. 41. Governments generally try to smooth out such fluctuations by stimulating aggregate demand when the economy is depressed and reducing aggregate demand when the economy is over-heating. Ideally, the government would wish to manage aggregate demand so that it grows exactly in line with the underlying growth of potential GNP, the dashed line in Fig. 41, exactly offsetting the amplitude of troughs and peaks of the business cycle.
Two main problems exist, however:
(a) the establishment of the correct timing of such an INJECTION or WITHDRAWAL;
(b) the establishment of the correct magnitude of an injection or withdrawal into the economy (to counter depressions and booms). With perfect timing and magnitude, the economy would follow the trend line of potential GNP.
A number of stages are involved in applying a stabilization policy as shown in the figure. For example, at time period zero the onset of a recession/depression would be reflected in a downturn in economic activity, although delays in the collection of economic statistics means that it is often time period 1 before data becomes available about unemployment rates, etc. Once sufficient data is to hand, the authorities are able to diagnose the nature of the problem (time period 2) and to plan appropriate intervention, such as tax cuts or increases in government expenditure (time period 3). At time period 4, the agreed measures are then implemented, although it may take some time before these measures have an effect on CONSUMPTION, INVESTMENT, IMPORTS, etc. (see MULTIPLIER). If the timing of these activities is incorrect, then the authorities may find that they have stimulated the economy at a time when it was already beginning to recover from recession/depression, so that their actions have served to exacerbate the original fluctuation (dotted line 1 in Fig. 41). The authorities could also exacerbate the fluctuation (dotted line 1) if they get the magnitudes wrong by injecting too much purchasing power into the economy, creating conditions of excess demand.
If the authorities can get the timing and magnitudes correct, then they should be able to counterbalance the effects of recession/depression and follow the path indicated as dotted line 2 in Fig. 41. Reducing the intensity of the recession in this way requires the authorities to FORECAST accurately the onset of recession some time demand management ahead, perhaps while the economy is still buoyant (time period 6). On the basis of these forecasts, the authorities can then plan their intervention to stimulate the economy (time period 7), activate these measures (time period 8), so that these measures begin to take effect and stimulate the economy as economic activity levels fall (time period 9).
Much government action is inaccurate in timing because of the institutional and behavioural complexities of the economy. Where the government has not been successful in adequately eradicating such peaks and troughs in the business cycle, it is frequently accused of having stop-go policies (see STOP-GO CYCLE), that is, of making injections into a recovering economy, which then ‘overheats’, and subsequently withdrawing too much at the wrong time, ‘braking’ too hard.
Demand management represents one facet of government macroeconomic policy, other important considerations being SUPPLY-SIDE policies, which affect the rate of growth of potential GNP, and EXCHANGE RATE policies, which affect the competitiveness of internationally traded goods and services. See DEFLATIONARY GAP, INFLATIONARY GAP, EQUILIBRIUM LEVEL OF NATIONAL INCOME, AUTOMATIC (BUILT-IN) STABILIZERS, INTERNAL-EXTERNAL BALANCE MODEL, PUBLIC FINANCE, BUDGET.
Fig. 41 Demand management.The management of aggregate demand in an economy.

demand-pull inflationa general increase in prices caused by a level of AGGREGATE DEMAND in excess of the supply potential of the economy. At full employment levels of output (POTENTIAL GROSS NATIONAL PRODUCT), excess demand bids up the price of a fixed real output (see INFLATIONARY GAP). According to MONETARISM, excess demand results from too rapid an increase in the MONEY SUPPLY. See INFLATION, QUANTITY THEORY OF MONEY, COST-PUSH INFLATION.
demand schedulea table listing various prices of a product and the specific quantities demanded at each of these prices. The information provided by a demand schedule can be used to construct a DEMAND CURVE showing the price-quantity demanded relationship in graphical form.
demand theorysee THEORY OF DEMAND.
demergerthe break-up of a company, often originally formed through a MERGER, into two (or more) separate companies. This is most easily achieved when the original businesses comprising the merger have continued to be run as separate divisions of the enlarged group. In this case, for example, the A-B company could be split into separate quoted companies, A and B, with the company’s existing shareholders being given shares in both companies. Thus, unlike a DIVESTMENT (the sale of a division to outside interests) or a MANAGEMENT BUY-OUT (the sale of a division to its existing management), initially at least the companies continue to be owned by their existing shareholders.
A demerger may occur because the merged company has failed to perform up to expectations because of internal conflicts of management, or may result from a rethink of the company’s BUSINESS STRATEGY favouring a concentration on ‘core’ businesses.
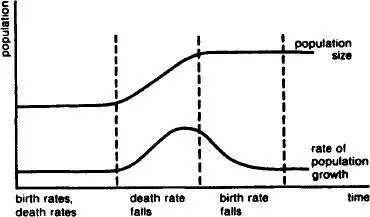
Fig. 42 Demographic transition.The levelling-off of the rate of population growth during a country’s economic development.
Читать дальшеИнтервал:
Закладка:
Похожие книги на «Economics»
Представляем Вашему вниманию похожие книги на «Economics» списком для выбора. Мы отобрали схожую по названию и смыслу литературу в надежде предоставить читателям больше вариантов отыскать новые, интересные, ещё непрочитанные произведения.


Обсуждение, отзывы о книге «Economics» и просто собственные мнения читателей. Оставьте ваши комментарии, напишите, что Вы думаете о произведении, его смысле или главных героях. Укажите что конкретно понравилось, а что нет, и почему Вы так считаете.