Dr. Pass - Economics
Здесь есть возможность читать онлайн «Dr. Pass - Economics» — ознакомительный отрывок электронной книги совершенно бесплатно, а после прочтения отрывка купить полную версию. В некоторых случаях можно слушать аудио, скачать через торрент в формате fb2 и присутствует краткое содержание. Жанр: unrecognised, на английском языке. Описание произведения, (предисловие) а так же отзывы посетителей доступны на портале библиотеки ЛибКат.
- Название:Economics
- Автор:
- Жанр:
- Год:неизвестен
- ISBN:нет данных
- Рейтинг книги:4 / 5. Голосов: 1
-
Избранное:Добавить в избранное
- Отзывы:
-
Ваша оценка:
Economics: краткое содержание, описание и аннотация
Предлагаем к чтению аннотацию, описание, краткое содержание или предисловие (зависит от того, что написал сам автор книги «Economics»). Если вы не нашли необходимую информацию о книге — напишите в комментариях, мы постараемся отыскать её.
Economics — читать онлайн ознакомительный отрывок
Ниже представлен текст книги, разбитый по страницам. Система сохранения места последней прочитанной страницы, позволяет с удобством читать онлайн бесплатно книгу «Economics», без необходимости каждый раз заново искать на чём Вы остановились. Поставьте закладку, и сможете в любой момент перейти на страницу, на которой закончили чтение.
Интервал:
Закладка:
deficiency paymentsee INCOME SUPPORT.
deficitsee BUDGET DEFICIT, BALANCE OF PAYMENTS.
deficit financingsee BUDGET DEFICIT, PUBLIC SECTOR BORROWING REQUIREMENT.
deflationa reduction in the level of NATIONAL INCOME and output usually accompanied by a fall in the general price level (DISINFLATION).
A deflation is often deliberately brought about by the authorities in order to reduce INFLATION and to improve the BALANCE OF PAYMENTS by reducing import demand. Instruments of deflationary policy include fiscal measures (e.g. tax increases) and monetary measures (e.g. high interest rates). See MONETARY POLICY, FISCAL POLICY.
deflationary gap or output gapthe shortfall in total spending (AGGREGATE DEMAND) at the FULL EMPLOYMENT level of national income (POTENTIAL GROSS NATIONAL PRODUCT). Because of a deficiency in spending, some of the economy’s resources lie idle and ACTUAL GROSS NATIONAL PRODUCT is below that of potential GNP. To counteract this deficiency in spending, the authorities can use FISCAL POLICY and MONETARY POLICY to expand aggregate demand. See Fig. 37. See also DEFLATION, REFLATION, INFLATIONARY GAP.
DEFRAsee DEPARTMENT FOR THE ENVIRONMENT, FOOD AND RURAL AFFAIRS.
deindustrializationa sustained fall in the proportion of national output accounted for by the industrial and manufacturing sectors of the economy, a process that is often accompanied by a decline in the number of people employed in industry (compare INDUSTRIALIZATION).
There is a well-established trend in advanced economics for the industrial sector to grow more slowly than the service sector, as shown in Fig. 38. For the UK, the share of industry in GDP fell from 43% in 1960 to 29% in 2002, while the share of services increased from 54% to 70%. Over the same period, employment in industry in the UK fell from 11.8 million in 1960 to 3.7 million in 2003.
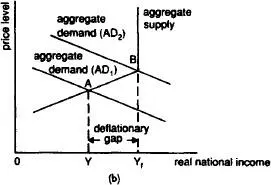
Fig. 37 Deflationary gap.(a) The AGGREGATE SUPPLY SCHEDULE is drawn as a 45-degree line because businesses will offer any particular level of output only if they expect total spending (aggregate demand) to be just sufficient to sell all of that output. However, once the economy reaches the full employment level of national income (OY 1), then actual output cannot expand further and at this level of output the aggregate supply schedule becomes vertical. (b) Alternatively, aggregate supply can be depicted in terms of the various levels of real national income supplied at each price level. Again, once the economy reaches the full employment level of real national income, the aggregate supply schedule becomes vertical. In both (a) and (b), if aggregate demand is at a low level (AD 1), then actual output (OY) will be determined by the intersection of AD 1and the aggregate supply schedule at point A; this output (OY) is less than potential output (OY 1), leaving an output gap. An output gap can be removed by the authorities by expanding aggregate demand to the full employment level of aggregate demand (AD 2) where actual output (determined by the intersection of AD 2and the aggregate supply schedule at point B) corresponds with potential GNP.
Changes in sector shares may simply reflect changes in the pattern of final demand for goods and services over time, and as such may be considered a ‘natural’ development associated with a maturing economy. On the other hand, deindustrialization that stems from supply-side deficiencies (high costs, an overvalued exchange rate, lack of investment and innovation) which put a country at a competitive disadvantage in international trade (see IMPORT PENETRATION) is a more serious matter. In this case, deindustrialization often brings with it a fall in national output, rising unemployment and balance of payments difficulties.
The extent of deindustrialization in the UK was even more marked in the early 1980s because of Britain’s artificially high exchange rate, bolstered by UK oil exports, which caused Britain to lose overseas markets. See STRUCTURE OF INDUSTRY, STRUCTURAL UNEMPLOYMENT.
Fig. 38 Deindustrialization.The distribution of gross national product shows how the industrial sector in advanced economics grows more slowly than the service sector. The figures for industry include those for manufacturing. Source: World Development Report, World Bank, 2004.
delivered pricingthe charging of a PRICE for a product that includes the cost of transporting the product from the manufacturer to the customer. The delivered prices quoted by a manufacturer might accurately reflect the actual costs of transportation to different areas, or alternatively, discriminatory prices might be used to cross-subsidize areas in order to maximize sales across the country. See BASING POINT PRICE SYSTEM.
delivery notea document sent by a supplier to a customer at the time when products are supplied that itemizes the physical quantities of product supplied. Thereafter an INVOICE is usually sent to the customer showing the money value of products supplied. Compare STATEMENT OF ACCOUNT.
demand or effective demandthe WANT, need or desire for a product backed by the money to purchase it. In economic analysis, demand is always based on ‘willingness and ability to pay’ for a product, not merely want or need for the product. CONSUMERS’ total demand for a product is reflected in the DEMAND CURVE. Compare SUPPLY.
demand curvea line showing the relationship between the PRICE of a PRODUCT or FACTOR OF PRODUCTION and the quantity DEMANDED per time period, as in Fig. 39.
Most demand curves slope downwards because (a) as the price of the product falls, consumers will tend to substitute this (now relatively cheaper) product for others in their purchases; (b) as the price of the product falls, this serves to increase their real income, allowing them to buy more products (see PRICE EFFECT, INCOME EFFECT, SUBSTITUTION EFFECT). In a small minority of cases, however, products can have an UPWARD-SLOPING CURVE.
The slope of the demand curve reflects the degree of responsiveness of quantity demanded to changes in the product’s price. For example, if a large reduction in price results in only a small increase in quantity demanded (as would be the case where the demand curve has a steep slope) then demand is said to be price inelastic (see PRICE-ELASTICITY OF DEMAND).
The demand curve interacts with the SUPPLY CURVE to determine the EQUILIBRIUM MARKET PRICE. See DEMAND FUNCTION, DEMAND CURVE (SHIFT IN), DIMINISHING MARGINAL UTILITY, MARGINAL REVENUE PRODUCT.
Fig. 39 Demand curve.Demand is the total quantity of a good or service that buyers are prepared to purchase at a given price. Demand is always taken to be effective demand , backed by the ability to pay, and not just based on want or need. The typical market demand curve slopes downwards from left to right, indicating that as price falls more is demanded (that is, a movement along the existing demand curve). Thus, if price falls from OP 1to OP 2, the quantity demanded will increase from OQ 1to OQ 2.
demand curve (shift in)a movement of the DEMAND CURVE from one position to another (either left or right) as a result of some economic change other than price. A given demand curve is always drawn on the CETERIS PARIBUS assumption that all the other factors affecting demand (income, tastes, etc.) are held constant. If any of these changes, however, then this will bring about a shift in the demand curve. For example, if income increases, the demand curve will shift to the right, so that more is now demanded at each price than formerly. See Fig. 40. See also DEMAND FUNCTION, INCOME-ELASTICITY OF DEMAND.
Читать дальшеИнтервал:
Закладка:
Похожие книги на «Economics»
Представляем Вашему вниманию похожие книги на «Economics» списком для выбора. Мы отобрали схожую по названию и смыслу литературу в надежде предоставить читателям больше вариантов отыскать новые, интересные, ещё непрочитанные произведения.


Обсуждение, отзывы о книге «Economics» и просто собственные мнения читателей. Оставьте ваши комментарии, напишите, что Вы думаете о произведении, его смысле или главных героях. Укажите что конкретно понравилось, а что нет, и почему Вы так считаете.