Brenda A. Wilson - Bacterial Pathogenesis
Здесь есть возможность читать онлайн «Brenda A. Wilson - Bacterial Pathogenesis» — ознакомительный отрывок электронной книги совершенно бесплатно, а после прочтения отрывка купить полную версию. В некоторых случаях можно слушать аудио, скачать через торрент в формате fb2 и присутствует краткое содержание. Жанр: unrecognised, на английском языке. Описание произведения, (предисловие) а так же отзывы посетителей доступны на портале библиотеки ЛибКат.

- Название:Bacterial Pathogenesis
- Автор:
- Жанр:
- Год:неизвестен
- ISBN:нет данных
- Рейтинг книги:5 / 5. Голосов: 1
-
Избранное:Добавить в избранное
- Отзывы:
-
Ваша оценка:
Bacterial Pathogenesis: краткое содержание, описание и аннотация
Предлагаем к чтению аннотацию, описание, краткое содержание или предисловие (зависит от того, что написал сам автор книги «Bacterial Pathogenesis»). Если вы не нашли необходимую информацию о книге — напишите в комментариях, мы постараемся отыскать её.
Completely revised and updated, and for the first time in stunning full-color, Bacterial Pathogenesis: A Molecular Approach, Fourth Edition, builds on the core principles and foundations of its predecessors while expanding into new concepts, key findings, and cutting-edge research, including new developments in the areas of the microbiome and CRISPR as well as the growing challenges of antimicrobial resistance. All-new detailed illustrations help students clearly understand important concepts and mechanisms of the complex interplay between bacterial pathogens and their hosts. Study questions at the end of each chapter challenge students to delve more deeply into the topics covered, and hone their skills in reading, interpreting, and analyzing data, as well as devising their own experiments. A detailed glossary defines and expands on key terms highlighted throughout the book. Written for advanced undergraduate, graduate, and professional students in microbiology, bacteriology, and pathogenesis, this text is a must-have for anyone looking for a greater understanding of virulence mechanisms across the breadth of bacterial pathogens.
Bacterial Pathogenesis — читать онлайн ознакомительный отрывок
Ниже представлен текст книги, разбитый по страницам. Система сохранения места последней прочитанной страницы, позволяет с удобством читать онлайн бесплатно книгу «Bacterial Pathogenesis», без необходимости каждый раз заново искать на чём Вы остановились. Поставьте закладку, и сможете в любой момент перейти на страницу, на которой закончили чтение.
Интервал:
Закладка:
Beyond the Metagenome
A shared limitation of the 16S rRNA gene and metagenomic analysis approaches is that they do not provide information about which genes are being expressed at any given time or what the functional activity of the community is under any particular condition. Since many bacteria that normally reside in or on the body may be expelled into the environment after traveling through the stomach and intestinal tract from their site of origin, it stands to reason that the site they normally occupy does not explain the presence of all of their genes. They have to endure stresses independent of the environment of the site in which they usually reside. Thus, only a subset of genes is likely to be expressed at any one time or at any particular site. Moreover, even within the same site, changes in conditions, such as changes in diet or hormonal levels, may cause increases or decreases in expression of certain sets of genes. Work is now underway to include additional information about the functional status of the microbial community by combining other types of functional information about gene, RNA, and protein expression levels, activity status, and flux of metabolite content.
RNA-Seq Profiling (Transcriptomics). Gene expression in complex populations can be measured using techniques that detect and quantitate mRNA levels, including qPCR (see Figure 5-5) and RNA-seq technology ( Figure 5-12). The Illumina RNA-seq paired-end sequencing platform has become the method of choice for interrogating the abundance and diversity of RNA transcripts (transcriptomics). The first step of RNA-seq is to extract and purify total RNA from the bacterial samples that will be compared. Different RNA purification methods are used for mRNA and small RNAs (sRNA) of less than 100 nucleotides. Highly abundant rRNAs and tRNAs are removed, and the mRNA samples are physically fragmented into smaller pieces. Reverse transcription is performed to convert the RNA fragments into cDNA, and the resulting cDNA is ligated to adapters, where barcode sequences mark cDNAs from different RNA samples. The cDNA + adapters are then subjected to the library amplification and Illumina sequencing, as illustrated in Figure 5-6.
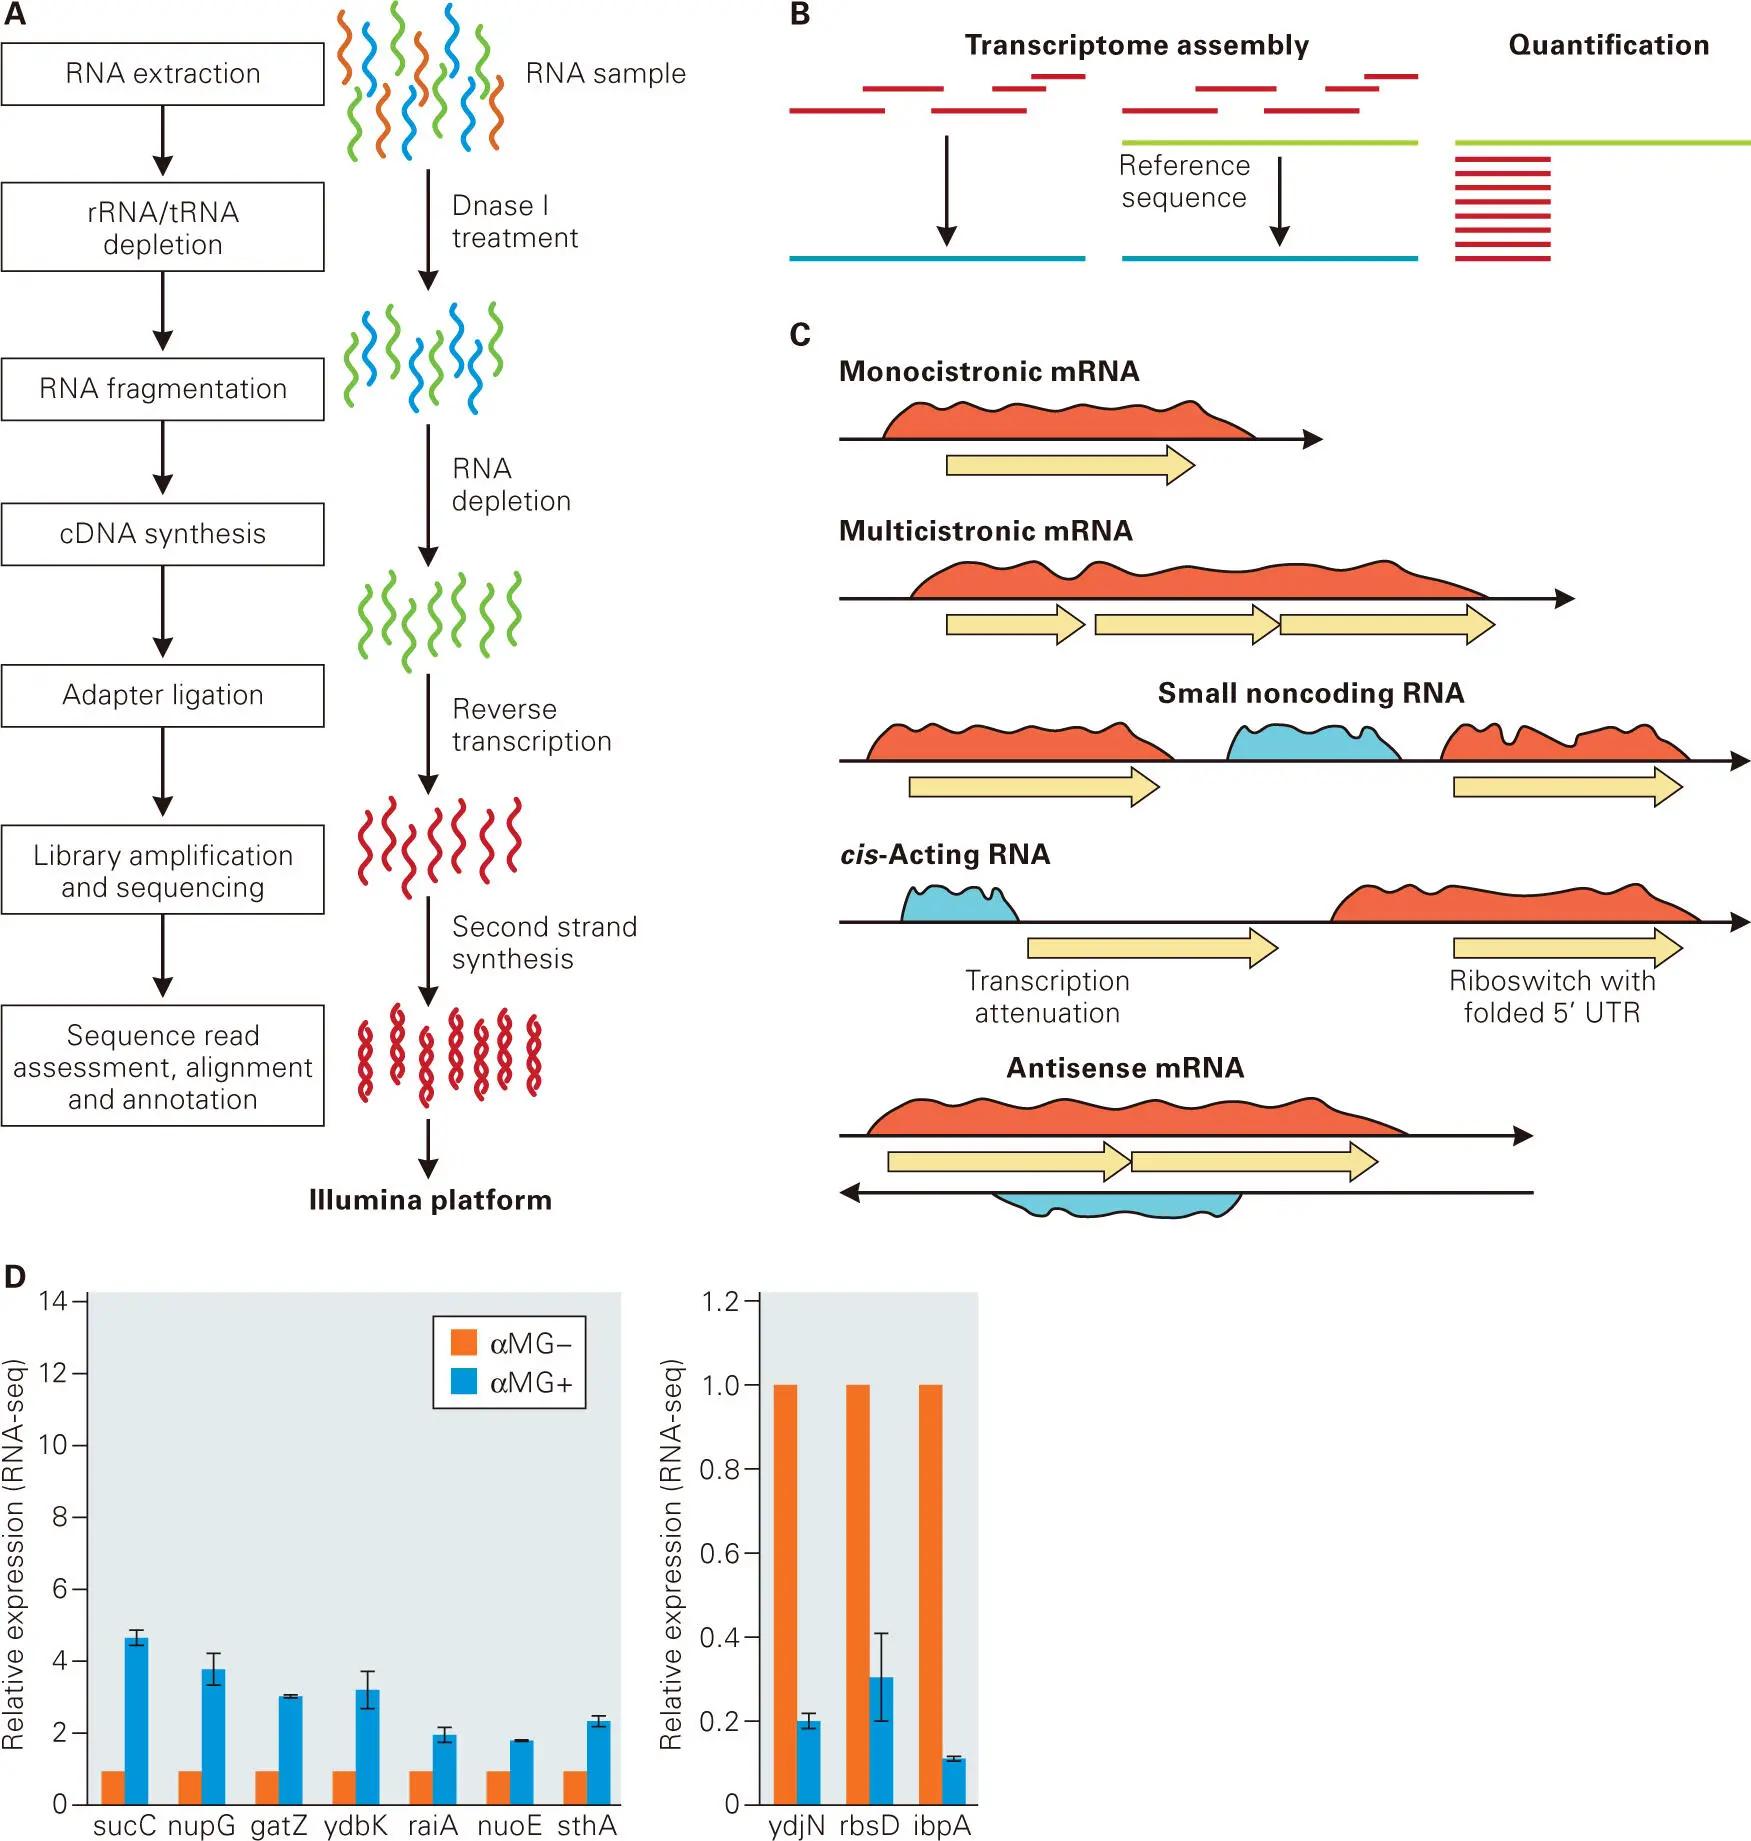
Figure 5-12. RNA-seq technology. The Illumina RNA-seq platform enables global profiling of the transcriptional responses of all genes in individual cells or tissues at considerable depth of coverage under multiple conditions or over time. (A) Steps in an RNA-seq experiment using Illumina sequencing described in the text and Figure 5-6. (B) Outcomes of aligning multiple separate, short (150–300 nucleotides) sequencing reads, which correspond to overlapping segments of mRNA or sRNA. Left, if a reference genome is not available for a bacterium, the separate overlapping reads can be aligned to show the length of a transcript. The transcript can then be analyzed for open reading frames (ORFs) or other features. Middle, if a reference genome is available, the aligned fragments can be compared to genomic features, such as ORFs, intercistronic regions, or predicted promoters and transcription terminators. Right, the number of reads for each nucleotide base in a transcript is proportional to the starting amount of mRNA or sRNA present in the sample. Hence, following normalization, relative transcript amounts can be determined in different bacterial strains or samples, such as in a wild-type bacterial strain compared to a mutant strain or a wild-type strain grown under an unstressed versus a stressed condition. See the text for additional details. (C) The number of nucleotide base reads (blue and red regions) is often constant across regions that are cotranscribed. Therefore, the read patterns across genes indicate monocistronic versus multicistronic operons, and also the presence of any sRNA, putative regulatory RNAs, or antisense RNAs. See the text for additional details. (D) An example of changes in relative transcript amounts determined by RNA-seq. An Escherichia coli strain was grown in medium lacking or containing a glucose analogue, α-methylglucoside (αMG). RNA-seq analysis showed that the relative transcript amounts of seven metabolic genes increased (left) and three metabolic genes decreased (right) in the bacteria treated with αMG compared to the untreated control. Independent quantitative reverse-transcription polymerase chain reaction (qRT-PCR) experiments confirmed the trend in expression changes detected by RNA-seq. Panel D adapted from McClure R, Balasubramanian D, Sun Y, Bobrovskyy M, Sumby P, Genco CA, Vanderpool CK, Tjaden B. 2013. Nucleic Acids Res 41(14):e140, with permission.
The output of the Illumina sequencing is millions of short-sequence reads of about 150–300 nucleotides that correspond to regions of transcribed mRNA and sRNA molecules in the original samples. Multiple samples can be sequenced simultaneously in each Illumina sequencing run, and sequence reads can be sorted by the unique barcode sequences used in the adapters ligated to cDNAs of each sample. Because mRNA is randomly fragmented in this procedure, a series of overlapping reads covering the length of each mRNA emerges, and each nucleotide base in the mRNA is determined multiple times in separate reads. The total number of reads of each nucleotide base is referred to as coverage, and for most mRNA molecules the coverage of each nucleotide base is approximately equal. However, keep in mind that the output of a single RNA-seq experiment is all of the separate mRNAs or sRNAs expressed in a bacterium.
Because of the immense volume of data acquired, computer bioinformatic analyses are required to align and display the separate mRNAs and sRNAs from RNA-seq experiments. From the separate reads, three kinds of analyses are possible ( Figure 5-12B). If a genomic DNA reference sequence is unknown, the overlapping reads can be aligned to indicate the length and sequence of individual mRNA molecules, which may contain open reading frames ( Figure 5-12B, left). If a reference genomic DNA sequence is known, then the RNA-seq data can be compared to annotated reading frames and intercistronic regions to indicate operon arrangements ( Figure 5-12B, middle). These kinds of analyses also provide identification of the locations of monocistronic and multicistronic operons, likely sRNA and regulatory RNAs that do not seem to encode proteins, and regions of antisense transcription ( Figure 5-12C).
Probably the biggest application of RNA-seq is quantitation of the relative amounts of gene transcripts in a wild-type bacterium compared to that of a mutant or to that of the wild-type bacterium subjected to a stress condition ( Figure 5-12B, right). The basis of this method is that the amount of cDNA synthesized and sequenced using the RNA-seq technology is proportional to the amount of mRNA or sRNA in the initial samples ( Figure 5-12A). That is, the number of nucleotide base reads for each mRNA or sRNA is proportional to the amount of mRNA and sRNA in the samples. More reads across a gene or operon relative to a wild-type standard or to control conditions indicate an increased transcript amount, whereas fewer reads indicate less relative transcription.
In quantitation experiments, total RNA is extracted from the two strains whose transcriptomes are to be compared (e.g., a wild-type versus mutant strain), prepared for RNA-seq with two sets of barcodes, and then subjected to Illumina sequencing. Normalization between samples is performed by summing the number of reads for each gene and dividing by the gene length and the total number of reads in that sample. The relative change in transcript amount can then be calculated and compared for each gene in the bacterium. An example is shown in Figure 5-12Dof the application of RNA-seq to determine the genes in E. coli whose relative transcript amounts increase or decrease in response to the glucose analogue, α-methylglucoside (αMG). As a final step in this transcriptome analysis, relative changes in transcript amounts detected by RNA-seq were confirmed by the independent method of quantitative reverse-transcription PCR (qRT-PCR). RNA-seq has largely replaced tiled microarrays for transcriptome analyses in bacteria and other organisms.
Читать дальшеИнтервал:
Закладка:
Похожие книги на «Bacterial Pathogenesis»
Представляем Вашему вниманию похожие книги на «Bacterial Pathogenesis» списком для выбора. Мы отобрали схожую по названию и смыслу литературу в надежде предоставить читателям больше вариантов отыскать новые, интересные, ещё непрочитанные произведения.


Обсуждение, отзывы о книге «Bacterial Pathogenesis» и просто собственные мнения читателей. Оставьте ваши комментарии, напишите, что Вы думаете о произведении, его смысле или главных героях. Укажите что конкретно понравилось, а что нет, и почему Вы так считаете.