Brenda A. Wilson - Bacterial Pathogenesis
Здесь есть возможность читать онлайн «Brenda A. Wilson - Bacterial Pathogenesis» — ознакомительный отрывок электронной книги совершенно бесплатно, а после прочтения отрывка купить полную версию. В некоторых случаях можно слушать аудио, скачать через торрент в формате fb2 и присутствует краткое содержание. Жанр: unrecognised, на английском языке. Описание произведения, (предисловие) а так же отзывы посетителей доступны на портале библиотеки ЛибКат.
- Название:Bacterial Pathogenesis
- Автор:
- Жанр:
- Год:неизвестен
- ISBN:нет данных
- Рейтинг книги:5 / 5. Голосов: 1
-
Избранное:Добавить в избранное
- Отзывы:
-
Ваша оценка:
Bacterial Pathogenesis: краткое содержание, описание и аннотация
Предлагаем к чтению аннотацию, описание, краткое содержание или предисловие (зависит от того, что написал сам автор книги «Bacterial Pathogenesis»). Если вы не нашли необходимую информацию о книге — напишите в комментариях, мы постараемся отыскать её.
Completely revised and updated, and for the first time in stunning full-color, Bacterial Pathogenesis: A Molecular Approach, Fourth Edition, builds on the core principles and foundations of its predecessors while expanding into new concepts, key findings, and cutting-edge research, including new developments in the areas of the microbiome and CRISPR as well as the growing challenges of antimicrobial resistance. All-new detailed illustrations help students clearly understand important concepts and mechanisms of the complex interplay between bacterial pathogens and their hosts. Study questions at the end of each chapter challenge students to delve more deeply into the topics covered, and hone their skills in reading, interpreting, and analyzing data, as well as devising their own experiments. A detailed glossary defines and expands on key terms highlighted throughout the book. Written for advanced undergraduate, graduate, and professional students in microbiology, bacteriology, and pathogenesis, this text is a must-have for anyone looking for a greater understanding of virulence mechanisms across the breadth of bacterial pathogens.
Bacterial Pathogenesis — читать онлайн ознакомительный отрывок
Ниже представлен текст книги, разбитый по страницам. Система сохранения места последней прочитанной страницы, позволяет с удобством читать онлайн бесплатно книгу «Bacterial Pathogenesis», без необходимости каждый раз заново искать на чём Вы остановились. Поставьте закладку, и сможете в любой момент перейти на страницу, на которой закончили чтение.
Интервал:
Закладка:
Coupling of RNA-seq results from total mRNA of a microbial community (metatranscriptomics) with the total genomic DNA content (metagenomics) enables an estimation of which metabolic pathways and protein functions are expressed in a particular sample under certain conditions. In this approach, relative mRNA transcript amounts are determined by the RNA-seq methods described previously. This approach can provide an estimation of the metabolic potential and physiological makeup of that particular microbiota. For example, one study comparing the gut metagenome (i.e., the predicted metabolic genes present) with the corresponding metatranscriptome (i.e., the relative transcription levels of the metabolic genes present) revealed that certain pathways, such as sporulation and amino acid biosynthesis, were consistently under-expressed, whereas other pathways, such as ribosome biogenesis, stress response, and methanogenesis, were consistently overexpressed in relation to their DNA abundance. These findings are consistent with the presumed roles of these pathways under the conditions in the gut. For instance, you would expect an abundance of amino acids in the gut from the digestion of foodstuffs so that bacteria would not need to make their own, and thus amino acid biosynthetic genes would be downregulated. On the other hand, the rich nutrient environment of the gut would encourage bacterial growth, such that there would be a lot of protein synthesis activity and ribosomal subunit genes would be strongly upregulated.
Proteomics and Metabolomics—the Emergence of Multi-Omics. Even the advances in metagenomics and metatranscriptomics may not be enough to fully characterize the functional activity of microbial communities. Two genes in a microbial population may encode the same type of enzyme or transport protein. But different enzymes and different transport proteins have different affinities for their substrates and different levels of activity. Additionally, there may be regulatory factors that impinge on the observed functional activity. Thus, a gene that is expressed at a higher level than another gene may not be more important metabolically or physiologically. To address this need for functional understanding at a population level, other measures of functional potential or activity of the microbiota are necessary.
Measuring the relative abundance of protein and metabolite (small molecule) amounts provides another indicator of the functional activity of a microbial community. Two approaches are now taking off that enable the assessment of proteins and metabolites in biological samples. Proteomics allows assessment of relative protein amounts and stabilities and functional states (activation, inactivation, or modification) of the protein content of samples ( Figure 5-13). Metabolomics allows the determination of the composition of all of the metabolites and other small molecules (usually any molecule with a molecular mass less than 1,500 Da) present in a sample ( Figure 5-14). Both approaches used to determine protein or metabolite content and abundance depend on chromatographic separation methods, usually high-performance liquid chromatography (HPLC) or gas chromatography (GC), followed by detection, structural determination, identification, and quantification of the contents using analytical techniques, such as mass spectrometry (MS), nuclear magnetic resonance (NMR) spectroscopy, or some other type of spectroscopy.
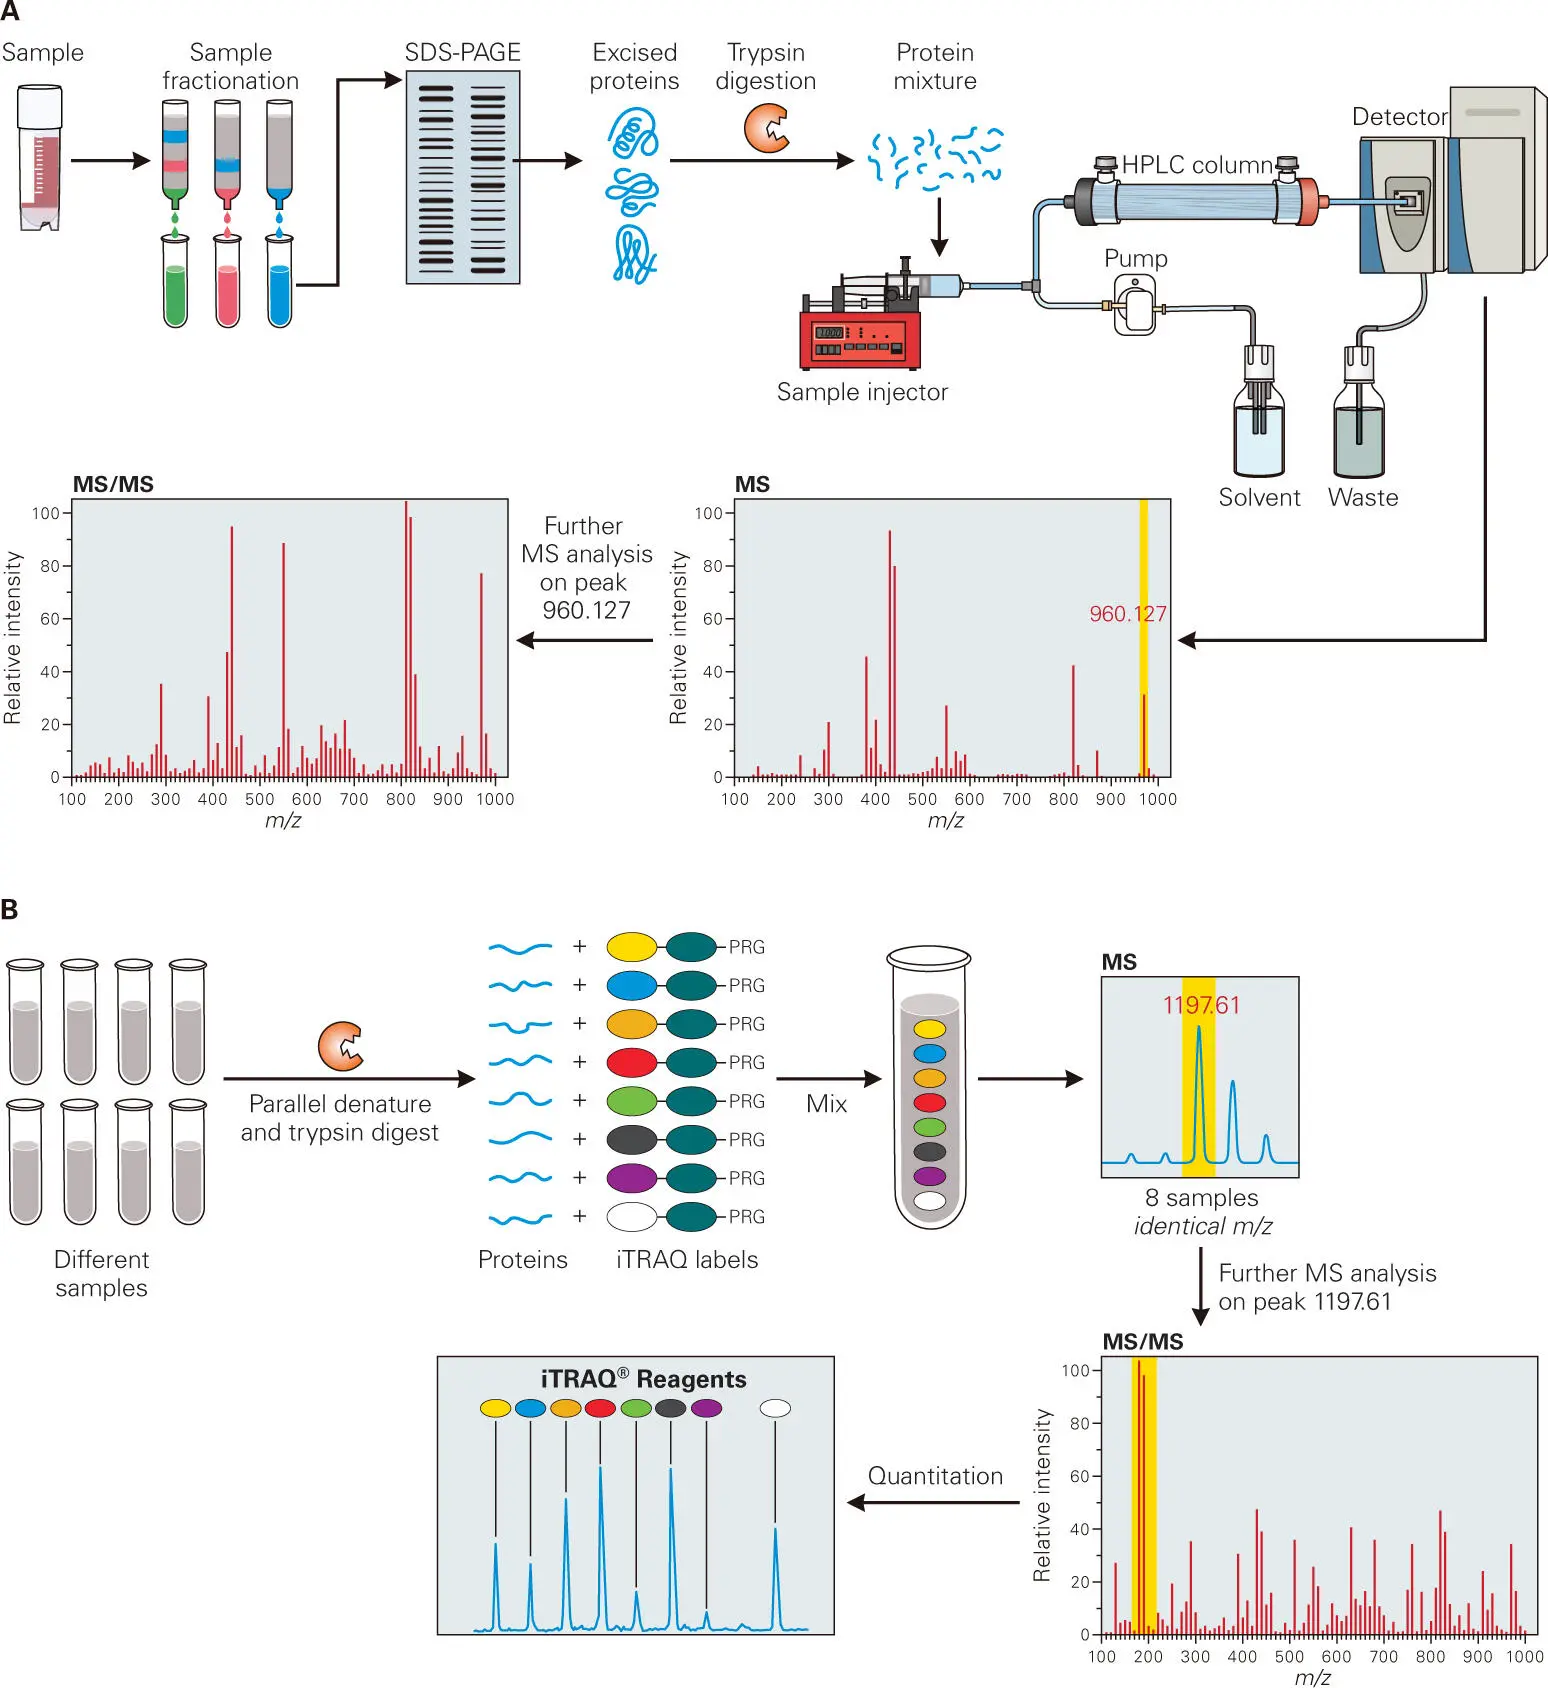
Figure 5-13. Overview of proteomics technology. Proteomics provides a comprehensive assessment of the protein identity and relative abundance in biological samples. (A) In the simplest identification, proteins in extracts of a bacterial culture are first fractionated by liquid chromatography (LC) and SDS polyacrylamide gel electrophoresis. Individual bands are cut out from gels, and the proteins are digested into peptides with trypsin protease. The resulting peptides are fractionated by high-performance liquid chromatography (HPLC) that is connected in-line to a mass spectrometer detector. The mass/charge (m/z) ratio is then determined for the peptides in the HPLC fraction that can be detected by mass spectrometry. Computer programs are then used to generate in silico predictions of the m/z ratios of all of the tryptic peptides that correspond to proteins predicted from the bacterial genome. The computer then matches the predictions with the peptide profile to identify the unknown protein. The identity of tryptic peptides can be further confirmed by tandem mass spectrometry (MS-MS) analysis, where fragments of the peptides to allow further structural determination of the peptides. With the newest ultra-performance LC systems and mass spectrometer detectors, this analysis has been expanded to complex mixtures of proteins in crude extracts. The crude protein mixtures are digested by trypsin and analyzed by liquid chromatography-mass spectrometry. The presence of as many as 700 proteins can be demonstrated by this method. However, these methods are only semiquantitative for determining the relative abundance of proteins in samples. Nevertheless, protein interaction or regulatory networks can be built for various purposes, such as signaling pathways, biosynthetic pathways, or protein-protein interaction pathways from these proteomic approaches. (B) iTRAQ method to quantitate relative protein amounts in different samples. As with RNA-seq, a major goal of proteomics is often to determine how the relative amounts of proteins change during bacterial growth in a standard unstressed condition compared with stressed conditions or in a wild-type compared to a mutant strain. An ingenious method, called iTRAQ, has been developed for this purpose. In an iTRAQ experiment, protein profiles from as many as eight separate cultures or conditions can be compared. The separate extracts are denatured and then digested to completion with trypsin. Each extract is reacted with one of the eight available iTRAQ labels, which do not change the relative m/z ratio for any given tryptic peptide. However, when each iTRAQ-labeled peptide is fragmented by MS-2, the peptides from the different samples end up with slightly different m/z values that allow resolution and quantitation of the iTRAQ-labeled fragments. The relative amount of each of the different iTRAQ-labeled peptide fragments is directly proportional to the amount of each protein that contains the peptide in the original samples. Adapted from PTM Biolabs (http://ptm-biolab.com/itraq-proteomics),with permission.
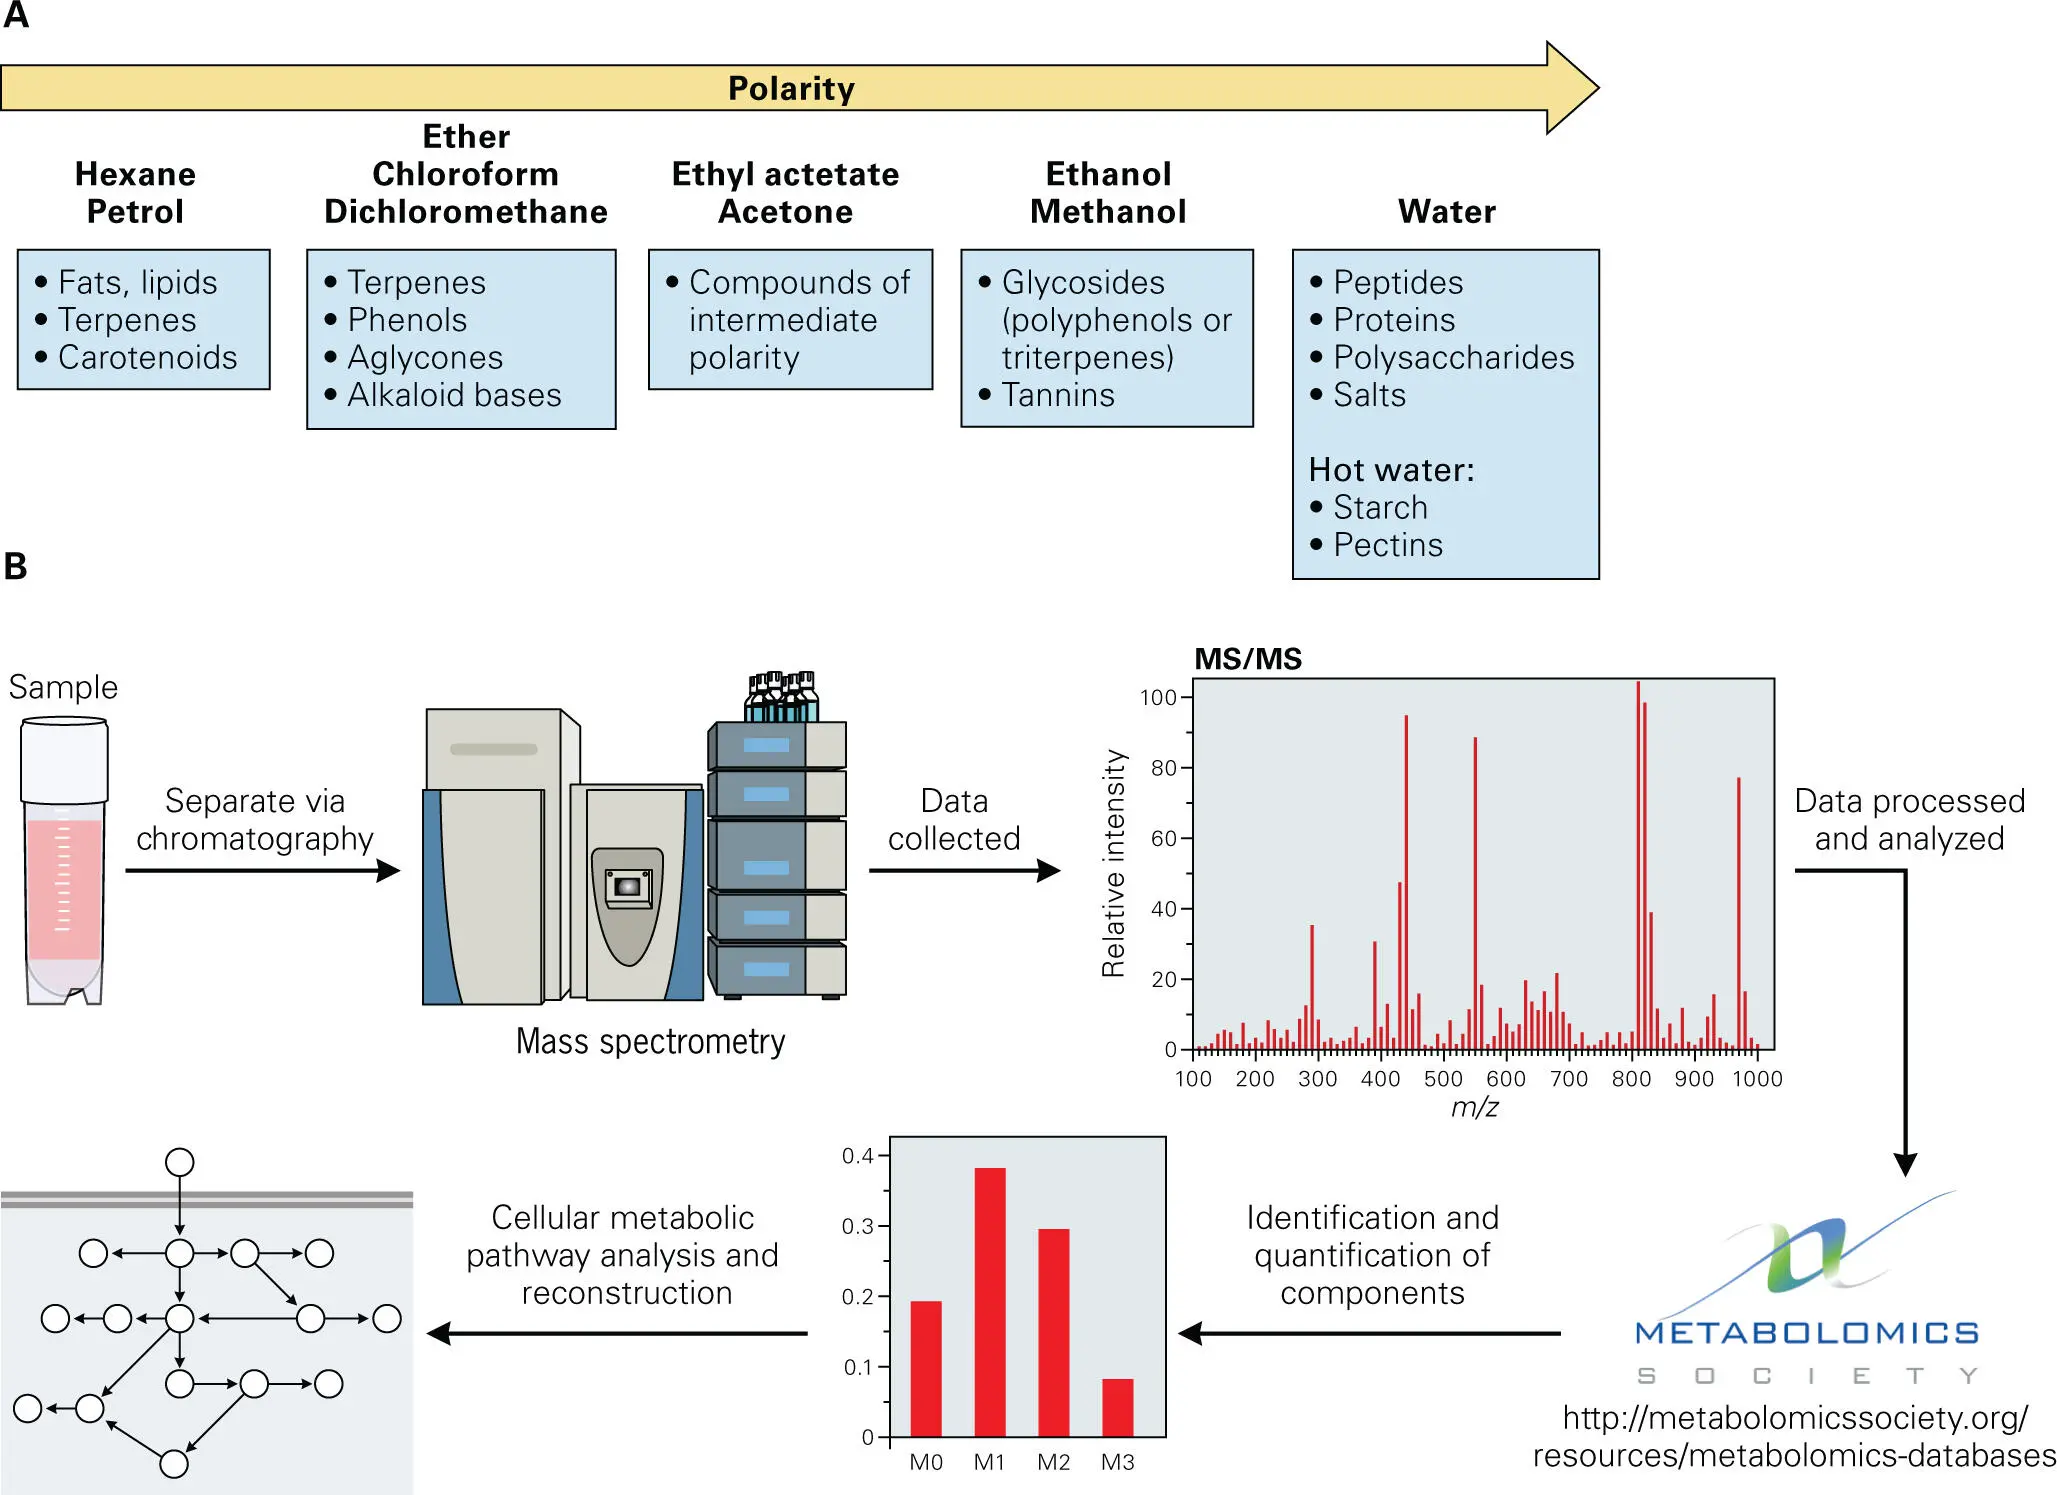
Figure 5-14. Overview of metabolomics technology. Metabolomics technology enables a comprehensive analysis of the content and relative abundance of low molecular weight (5–1,500 Da) molecules or metabolites within a sample, which provides a better assessment of which metabolic pathways are active and what the relative flux through those pathways is. (A) The samples are processed using solvent extraction methods with various polarities that are specific for a particular type of molecule, such as lipids, sugars, or small organic molecules. (B) The extracted compounds are then separated from each other via chromatographic methods such as high-performance liquid chromatography or gas chromatography either directly or after chemical derivatization (to enhance solubility). This is followed by structural analysis using detection technologies, such as mass spectrometry or nuclear magnetic resonance spectroscopy. The data are then processed and analyzed using bioinformatics tools and comparison with existing data from known compounds in available databases to determine the structure and identity of the components and their relative abundance in the sample. The metabolites identified are then mapped onto cellular signaling and biosynthetic pathways. A comprehensive list of metabolomics databases and resources can be found at the website for the Metabolomics Society (http://metabolomicssociety.org).
Читать дальшеИнтервал:
Закладка:
Похожие книги на «Bacterial Pathogenesis»
Представляем Вашему вниманию похожие книги на «Bacterial Pathogenesis» списком для выбора. Мы отобрали схожую по названию и смыслу литературу в надежде предоставить читателям больше вариантов отыскать новые, интересные, ещё непрочитанные произведения.


Обсуждение, отзывы о книге «Bacterial Pathogenesis» и просто собственные мнения читателей. Оставьте ваши комментарии, напишите, что Вы думаете о произведении, его смысле или главных героях. Укажите что конкретно понравилось, а что нет, и почему Вы так считаете.