Zark Bedalov - Practical Power Plant Engineering
Здесь есть возможность читать онлайн «Zark Bedalov - Practical Power Plant Engineering» — ознакомительный отрывок электронной книги совершенно бесплатно, а после прочтения отрывка купить полную версию. В некоторых случаях можно слушать аудио, скачать через торрент в формате fb2 и присутствует краткое содержание. Жанр: unrecognised, на английском языке. Описание произведения, (предисловие) а так же отзывы посетителей доступны на портале библиотеки ЛибКат.

- Название:Practical Power Plant Engineering
- Автор:
- Жанр:
- Год:неизвестен
- ISBN:нет данных
- Рейтинг книги:5 / 5. Голосов: 1
-
Избранное:Добавить в избранное
- Отзывы:
-
Ваша оценка:
Practical Power Plant Engineering: краткое содержание, описание и аннотация
Предлагаем к чтению аннотацию, описание, краткое содержание или предисловие (зависит от того, что написал сам автор книги «Practical Power Plant Engineering»). Если вы не нашли необходимую информацию о книге — напишите в комментариях, мы постараемся отыскать её.
The book explores the most relevant topics and reviews the industry standards and established engineering practices. For example, the author leads the reader through the application of MV switchgear, MV controllers, MCCs and distribution lines in building plant power distribution systems, including calculations of interrupting duty for breakers and contactors. The text also contains useful information on the various types of concentrated and photovoltaic solar plants as well as wind farms with DFIG turbines. This important book:
• Explains why and how to select the proper ratings for electrical equipment for specific applications
• Includes information on the critical requirements for designing power systems to meet the performance requirements
• Presents tests of the electrical equipment that prove it is built to the required standards and will meet plant-specific operating requirements
Written for both professional engineers early in their career and experienced engineers,
is a must-have resource that offers the information needed to apply the concepts of power plant engineering in the real world.
Practical Power Plant Engineering — читать онлайн ознакомительный отрывок
Ниже представлен текст книги, разбитый по страницам. Система сохранения места последней прочитанной страницы, позволяет с удобством читать онлайн бесплатно книгу «Practical Power Plant Engineering», без необходимости каждый раз заново искать на чём Вы остановились. Поставьте закладку, и сможете в любой момент перейти на страницу, на которой закончили чтение.
Интервал:
Закладка:
1.4.3 Marginal Cost of Energy
The LCOE cost can be considered the average cost of a particular type of generating source. Utilities are interested in the marginal energy cost also. It is the cost experienced by the utilities for the last (peaking) kWh of electricity produced and sold. The marginal cost is highly variable and could vary throughout the day between negative pricing when there is over generation and could increase to hundreds of $/MWh when the demand is high and supply is low. The marginal cost determines the ranking of the type of generating source that will be dispatched. Those with the lowest marginal costs are the first ones to be energized to meet the demand, while the plants with the highest marginal costs are the last to be brought on line.
For example, a wind or solar power plant has no fuel cost and relatively low O&M costs. It yields the lowest marginal energy provided when the sun is shining and the wind is blowing. There is a big difference in production cost whether the plant is generating 1 or 100 MW. Similarly, a gas turbine plant also has low marginal cost if the gas price is low, which it is right now (2017).
1.4.4 Profitability of an Industrial Plant
What is the profitability of an industrial plant? The investor is typically interested in the initial capex and a quick construction schedule to insure a quick loan repayment from the plant operating cost. The investors like to use a simple formula called a “ payback time.” The investor is typically looking at a maximum of five‐year payback plan to repay the cost of the initial plant (capex) with the sale of the product, ore, or other merchandize and enjoy a loan and cost‐free life thereafter. Naturally, the economics are highly dependent on the commodity prices of the materials produced. Once the project is initiated, the cost estimate follows a more detailed approach.
Reference
1 1 IRENA: International Renewable Energy Agency (2014). LCOE, Levelized Cost of Energy.
Note
1 1If you want to convert between the two, it is handy to remember that 1c/kWh = 10$/MWh.
2 Plant Key One‐Line Diagram
CHAPTER MENU
2.1 One‐Line Diagrams 2.1.1 What Is the One‐Line Diagram, or Single‐Line Diagram?
2.2 The Electrical Project
2.3 Site Conditions2.3.1 Source of Power 2.3.2 Ambient Derating Factors 2.3.3 Reliability Criteria
2.4 Connection to Power Utility 2.4.1 Source Impedance 2.4.2 Line Conductor 2.4.3 HV Circuit Breaker Fault Interrupting 2.4.4 Double or Single Incomer Connection 2.4.5 Utility Generating Capacity 2.4.6 Firm Capacity 2.4.7 Line Protection 2.4.8 Lightning
2.5 Main Plant Substation
2.6 Load Site Placement 2.6.1 Crushing 2.6.2 Grinding and Conveying
2.7 The Key One‐Line Diagram2.7.1 Load Investigation 2.7.2 Connected Load – Operating Load 2.7.3 Voltage Level Selection 2.7.4 Switchgear Breaker Ratings 2.7.5 Single Incomer Substation for a Small Plant 2.7.6 13.8 or 33 kV Switchgear for a Larger Plant 2.7.7 Transformer Connections: Cable, Cable Bus, or Bus Duct? 2.7.8 Medium Voltage Switchgear and Controllers (4.16 kV) 2.7.9 Low Voltage Service Voltage 2.7.10 Bus Tie Breaker Switching 2.7.11 Plant Transformation 2.7.12 Voltage Regulation 2.7.13 Overhead Distribution Lines
2.8 Transformer System Grounding 2.8.1 Transmission Level 2.8.2 MV Systems 2.8.3 LV Systems 2.8.4 Generator Neutrals
2.9 Transformer Winding Configurations and Phasing
2.10 Standby Power
2.11 Insulation Coordination 2.11.1 Substation Shielding
2.12 Plant Control System
2.13 Fire Protection
Reference
2.1 One‐Line Diagrams
Designing a Key one‐line diagramis the most important task in the development of an electrical system for a power or an industrial plant. This diagram is a result of the key decisions made by the engineers working on the project. This book devotes significant time in explaining the electrical components, which are fundamental in building the functional electrical one‐line diagram.
The one‐line diagram represents the electrical power distribution formed to suit the technological process for the proposed project (see Chapter 1). The electrical engineers must focus on acquiring information on the type of process, load magnitude, load centers, quality and availability of power, power loss tolerance, and required plant reliability.
The key one‐line diagram prepared at the initial stage of design will be conceptual in nature. It will encompass the other one‐line diagrams for the specific parts of the plant. It will serve for discussions, cost estimates, and to offer the other design team engineers a basis for their equipment selections. Figure 2.1is not a “key” diagram, but a part of a plant one line diagram.
The design procedure in this chapter is described in light detail to arouse interest of the electrical engineers in the design and operation of electrical systems for industrial manufacturing and power plants. More clarifying details related to the specific equipment specifications, applications, and reasons for their selection can be found in the chapters that follow.
2.1.1 What Is the One‐Line Diagram, or Single‐Line Diagram?
Mechanical engineers have their “flow diagrams.” Electrical engineers have their single‐line diagrams showing the electrical power flows and plant overall integration. As the name implies, it is the principal electrical diagram or our big picture of the plant or specific part of the plant, whereby the three phases are represented in a simplified single‐line form. The diagrams show all the major transformers, loads, circuit breakers, and cables or line connections, including the ratings: kW (HP), MVA, V, A, AWG (mm 2), leading to the major plant equipment. The key diagram includes references to the partial more detailed one‐line diagrams for the specific process areas. One medium size industrial plant may have 20 individual one‐line diagrams starting from the key one‐line diagram down to the individual MCC 480 V (400 V) diagrams.
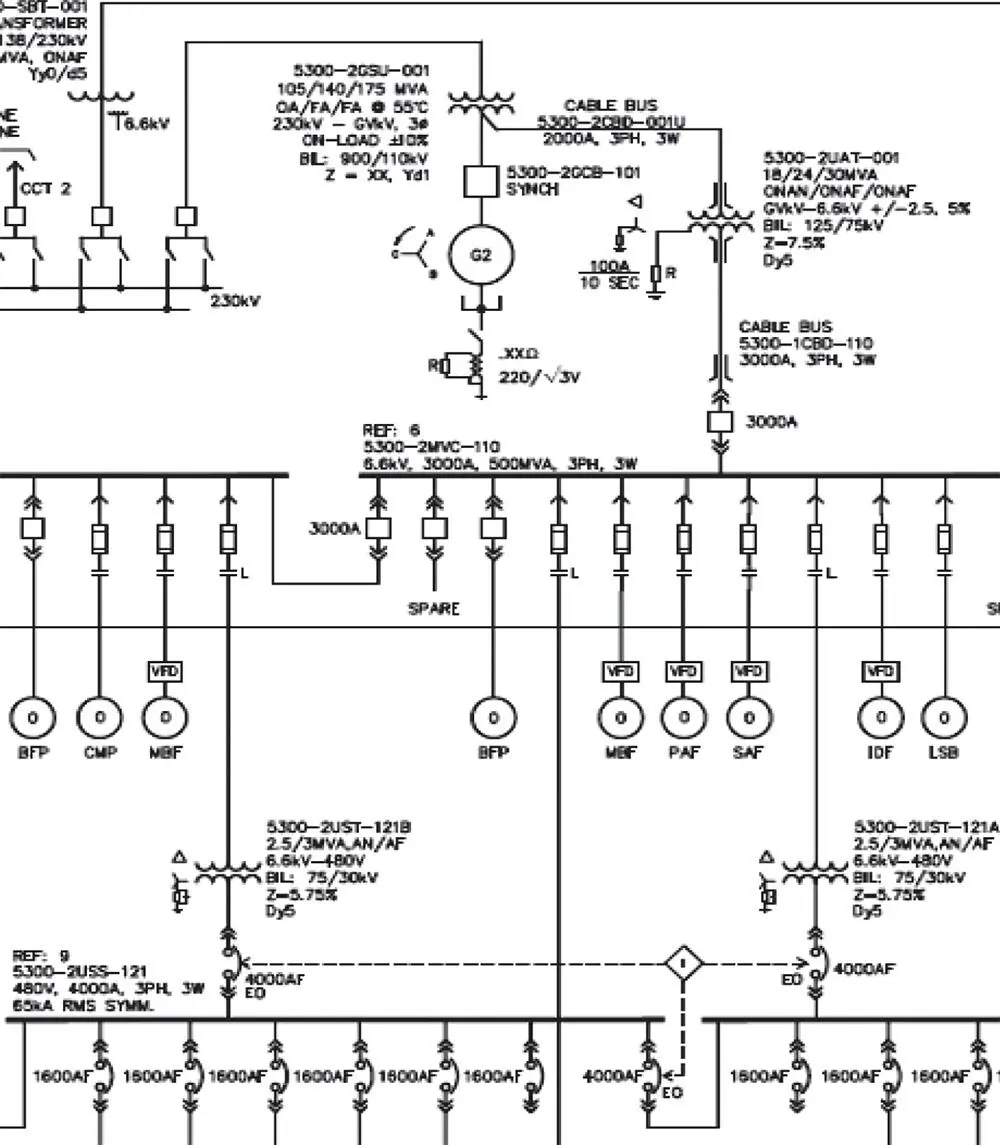
Figure 2.1 Part of a plant one line diagram.
Decisions must be made on the main switchyard, the number of incoming transformers, and the selection of the plant busbar voltages for distribution of power to the major load centers for large and small loads and primary and secondary power lines to remote plant facilities.
Note: The voltages and frequency applied in this book will be those of the North American standards. The principles of calculations and application used here are equally applicable to the IEC system voltages used in the other parts of the world.
2.2 The Electrical Project
The activities presented in this book, some of it in this chapter as part of the electrical design, include the following:
Determine the site conditions and discuss the interconnection with local Utility.
Review of mechanical load flow diagrams, P&D diagrams and establish load (kW) estimates and voltage levels.
Prepare one‐line diagrams and plant design criteria.
Conduct system studies and determine electrical equipment ratings.
As the starting point, the mechanical engineers will develop 10–20 flow diagrams of the plant process. A small part of the ore handling flow diagram is shown in Figure 2.2. The process (instrumentation) engineers will develop 30–40 process piping and instrumentation diagrams (P&ID) to instrument and automate the plant, as shown on a small P&ID segment in Figure 2.3for a feed pump. The P&ID gives us the indications on how the plant will be controlled, monitored, and operated.
Читать дальшеИнтервал:
Закладка:
Похожие книги на «Practical Power Plant Engineering»
Представляем Вашему вниманию похожие книги на «Practical Power Plant Engineering» списком для выбора. Мы отобрали схожую по названию и смыслу литературу в надежде предоставить читателям больше вариантов отыскать новые, интересные, ещё непрочитанные произведения.


Обсуждение, отзывы о книге «Practical Power Plant Engineering» и просто собственные мнения читателей. Оставьте ваши комментарии, напишите, что Вы думаете о произведении, его смысле или главных героях. Укажите что конкретно понравилось, а что нет, и почему Вы так считаете.