Bhisham C. Gupta - Statistics and Probability with Applications for Engineers and Scientists Using MINITAB, R and JMP
Здесь есть возможность читать онлайн «Bhisham C. Gupta - Statistics and Probability with Applications for Engineers and Scientists Using MINITAB, R and JMP» — ознакомительный отрывок электронной книги совершенно бесплатно, а после прочтения отрывка купить полную версию. В некоторых случаях можно слушать аудио, скачать через торрент в формате fb2 и присутствует краткое содержание. Жанр: unrecognised, на английском языке. Описание произведения, (предисловие) а так же отзывы посетителей доступны на портале библиотеки ЛибКат.

- Название:Statistics and Probability with Applications for Engineers and Scientists Using MINITAB, R and JMP
- Автор:
- Жанр:
- Год:неизвестен
- ISBN:нет данных
- Рейтинг книги:4 / 5. Голосов: 1
-
Избранное:Добавить в избранное
- Отзывы:
-
Ваша оценка:
Statistics and Probability with Applications for Engineers and Scientists Using MINITAB, R and JMP: краткое содержание, описание и аннотация
Предлагаем к чтению аннотацию, описание, краткое содержание или предисловие (зависит от того, что написал сам автор книги «Statistics and Probability with Applications for Engineers and Scientists Using MINITAB, R and JMP»). Если вы не нашли необходимую информацию о книге — напишите в комментариях, мы постараемся отыскать её.
Statistics and Probability with Applications for Engineers and Scientists using MINITAB, R and JMP, Second Edition Features two new chapters—one on Data Mining and another on Cluster Analysis Now contains R exhibits including code, graphical display, and some results MINITAB and JMP have been updated to their latest versions Emphasizes the p-value approach and includes related practical interpretations Offers a more applied statistical focus, and features modified examples to better exhibit statistical concepts Supplemented with an Instructor's-only solutions manual on a book’s companion website
is an excellent text for graduate level data science students, and engineers and scientists. It is also an ideal introduction to applied statistics and probability for undergraduate students in engineering and the natural sciences.
Statistics and Probability with Applications for Engineers and Scientists Using MINITAB, R and JMP — читать онлайн ознакомительный отрывок
Ниже представлен текст книги, разбитый по страницам. Система сохранения места последней прочитанной страницы, позволяет с удобством читать онлайн бесплатно книгу «Statistics and Probability with Applications for Engineers and Scientists Using MINITAB, R and JMP», без необходимости каждый раз заново искать на чём Вы остановились. Поставьте закладку, и сможете в любой момент перейти на страницу, на которой закончили чтение.
Интервал:
Закладка:
14 Refer to the data in Problem 13 above. Construct a stem‐and‐leaf diagram for these data.
15 The following data give the consumption of electricity in kilowatt‐hours during a given month in 30 rural households in Maine:260290280240250230310305264286262241209226278206217247268207226247250260264233213265206225Construct, using technology, a stem‐and‐leaf diagram for these data.Comment on what you learn from these data.
2.5 Numerical Measures of Quantitative Data
Methods used to derive numerical measures for sample data as well as population data are known as numerical methods .
Definition 2.5.1
Numerical measures computed by using data of the entire population are referred to as parameters .
Definition 2.5.2
Numerical measures computed by using sample data are referred to as statistics .
In the field of statistics, it is standard practice to denote parameters by letters of the Greek alphabet and statistics by letters of the Roman alphabet.
We divide numerical measures into three categories: (i) measures of centrality, (ii) measures of dispersion, and (iii) measures of relative position. Measures of centrality give us information about the center of the data, measures of dispersion give information about the variation around the center of the data, and measures of relative position tell us what percentage of the data falls below or above a given measure.
2.5.1 Measures of Centrality
Measures of centrality are also known as measures of central tendency. Whether referring to measures of centrality or central tendency, the following measures are of primary importance:
1 Mean
2 Median
3 Mode
The mean, also sometimes referred to as the arithmetic mean, is the most useful and most commonly used measure of centrality. The median is the second most used, and the mode is the least used measure of centrality.
Mean
The mean of a sample or a population is calculated by dividing the sum of the data measurements by the number of measurements in the data. The sample mean is also known as sample average and is denoted by  (read as X bar), and the population mean is denoted by the Greek letter
  (read as meu). These terms are defined as follows:
( 2.5.1) 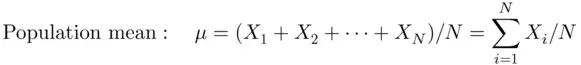
(2.5.2) 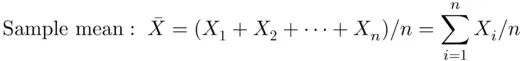
In ( 2.5.1),  denotes the value of the variable
  possessed by the
  th member of the population,
 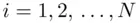 . In ( 2.5.2), the
  denotes the
  th measurement made in a sample of size
  . Here,
  and
and  denote the population and sample size, respectively, and
  . The symbol
  (read as sigma) denotes the summation over all the measurements. Note that here
  is a statistic, and
  is a parameter.
Example 2.5.1(Workers' hourly wages) The data in this example give the hourly wages (in dollars) of randomly selected workers in a manufacturing company:
8, 6, 9, 10, 8, 7, 11, 9, 8
Find the sample average and thereby estimate the mean hourly wage of these workers.
Solution:Since wages listed in these data are for only some of the workers in the company, the data represent a sample. Thus, we have  , and the observed
  is
is
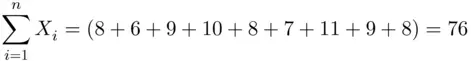
Thus, the sample average is observed to be
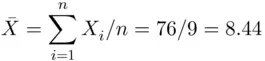
In this example, the average hourly wage of these employees is $8.44 an hour.
Example 2.5.2(Ages of employees) The following data give the ages of all the employees in a city hardware store:
22, 25, 26, 36, 26, 29, 26, 26
Find the mean age of the employees in that hardware store.
Solution:Since the data give the ages of all the employees of the hardware store, we are dealing with a population . Thus, we have
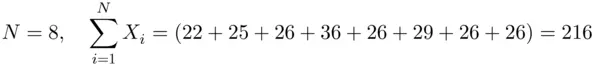
so that the population mean is
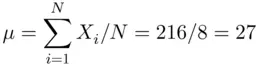
In this example, the mean age of the employees in the hardware store is 27 years.
Читать дальшеИнтервал:
Закладка:
Похожие книги на «Statistics and Probability with Applications for Engineers and Scientists Using MINITAB, R and JMP»
Представляем Вашему вниманию похожие книги на «Statistics and Probability with Applications for Engineers and Scientists Using MINITAB, R and JMP» списком для выбора. Мы отобрали схожую по названию и смыслу литературу в надежде предоставить читателям больше вариантов отыскать новые, интересные, ещё непрочитанные произведения.


Обсуждение, отзывы о книге «Statistics and Probability with Applications for Engineers and Scientists Using MINITAB, R and JMP» и просто собственные мнения читателей. Оставьте ваши комментарии, напишите, что Вы думаете о произведении, его смысле или главных героях. Укажите что конкретно понравилось, а что нет, и почему Вы так считаете.