Bhisham C. Gupta - Statistics and Probability with Applications for Engineers and Scientists Using MINITAB, R and JMP
Здесь есть возможность читать онлайн «Bhisham C. Gupta - Statistics and Probability with Applications for Engineers and Scientists Using MINITAB, R and JMP» — ознакомительный отрывок электронной книги совершенно бесплатно, а после прочтения отрывка купить полную версию. В некоторых случаях можно слушать аудио, скачать через торрент в формате fb2 и присутствует краткое содержание. Жанр: unrecognised, на английском языке. Описание произведения, (предисловие) а так же отзывы посетителей доступны на портале библиотеки ЛибКат.

- Название:Statistics and Probability with Applications for Engineers and Scientists Using MINITAB, R and JMP
- Автор:
- Жанр:
- Год:неизвестен
- ISBN:нет данных
- Рейтинг книги:4 / 5. Голосов: 1
-
Избранное:Добавить в избранное
- Отзывы:
-
Ваша оценка:
Statistics and Probability with Applications for Engineers and Scientists Using MINITAB, R and JMP: краткое содержание, описание и аннотация
Предлагаем к чтению аннотацию, описание, краткое содержание или предисловие (зависит от того, что написал сам автор книги «Statistics and Probability with Applications for Engineers and Scientists Using MINITAB, R and JMP»). Если вы не нашли необходимую информацию о книге — напишите в комментариях, мы постараемся отыскать её.
Statistics and Probability with Applications for Engineers and Scientists using MINITAB, R and JMP, Second Edition Features two new chapters—one on Data Mining and another on Cluster Analysis Now contains R exhibits including code, graphical display, and some results MINITAB and JMP have been updated to their latest versions Emphasizes the p-value approach and includes related practical interpretations Offers a more applied statistical focus, and features modified examples to better exhibit statistical concepts Supplemented with an Instructor's-only solutions manual on a book’s companion website
is an excellent text for graduate level data science students, and engineers and scientists. It is also an ideal introduction to applied statistics and probability for undergraduate students in engineering and the natural sciences.
Statistics and Probability with Applications for Engineers and Scientists Using MINITAB, R and JMP — читать онлайн ознакомительный отрывок
Ниже представлен текст книги, разбитый по страницам. Система сохранения места последней прочитанной страницы, позволяет с удобством читать онлайн бесплатно книгу «Statistics and Probability with Applications for Engineers and Scientists Using MINITAB, R and JMP», без необходимости каждый раз заново искать на чём Вы остановились. Поставьте закладку, и сможете в любой момент перейти на страницу, на которой закончили чтение.
Интервал:
Закладка:
Even though the formulas for calculating sample average and population mean are very similar, it is important to make a clear distinction between the sample mean or sample average  and the population mean
  for all application purposes.
Sometimes, a data set may include a few observations that are quite small or very large. For examples, the salaries of a group of engineers in a big corporation may include the salary of its CEO, who also happens to be an engineer and whose salary is much larger than that of other engineers in the group. In such cases, where there are some very small and/or very large observations, these values are referred to as extreme values or outliers . If extreme values are present in the data set, then the mean is not an appropriate measure of centrality. Note that any extreme values, large or small, adversely affect the mean value. In such cases, the median is a better measure of centrality since the median is unaffected by a few extreme values. Next, we discuss the method to calculate the median of a data set.
Median
We denote the median of a data set by  . To determine the median of a data set of size
  , we take the following steps:
1 Step 1. Arrange the observations in the data set in an ascending order and rank them from 1 to .
2 Step 2. Find the rank of the median that is given by( 2.5.3) We can check manually that the conditions of Definition 2.4.2are satisfied.
3 Step 3. Find the value of the observation corresponding to the rank of the median found in (2.5.3). If denotes the th largest value in the sample, and if(i) odd, say , then the median is (ii) even, say , then the median is taken as
Note that in the second case, we take median as the average of  and
and  because both satisfy the two conditions of Definition 2.4.2, resulting in their mean being adopted as a compromise between these two values for the value of
  .
.
We now give examples of each case,  odd and
  even.
even.
Example 2.5.3(Alignment pins for the case of n odd,  ) The following data give the length (in mm) of an alignment pin for a printer shaft in a batch of production:
30, 24, 34, 28, 32, 35, 29, 26, 36, 30, 33
Find the median alignment pin length.
Solution:
1 Step 1. Write the data in an ascending order and rank them from 1 to 11, since .Observations in ascending order2426282930303233343536Ranks1234567891011
2 Step 2. Rank of the median .
3 Step 3. Find the value corresponding to rank 6, which in this case is equal to 30. Thus, the median alignment pin length is mm. This means that at most 50% alignment pins in the sample are of length less than or equal to 30 and at the most 50% are of length greater than or equal to 30 mm.
Example 2.5.4(Sales data) For the case of  even (i.e.,
  ), the following data describe the sales (in thousands of dollars) for 16 randomly selected sales personnel distributed throughout the United States:
10 8 15 12 17 7 20 19 22 25 16 15 18 250 300 12
Find the median sale of these individuals.
Solution:
1 Step 1. Write the data in an ascending order and rank them from 1 to 16, since .Observations in ascending order78101212151516171819202225250300Ranks12345678910111213141516
2 Step 2. Rank of the median .
3 Step 3. Following our previous discussion, the median in this case is the average of the values corresponding to their ranks of 8 and 9. Thus, the median of this data is . In other words, the median sales of the given individuals is $16,500. We remark that eight observations fall below 16.5, and eight observations fall above 16.5.
It is important to note that the median may or may not be one of the values of the data set as in this case. Whenever the sample size is odd, the median is the center value, and whenever it is even, the median is always the average of the two middle values when the data are arranged in the ascending order.
Finally, note that the data in this example contain the two values $250,000 and $300,000. These large values seem to be the sales of top‐performing sales personnel and may be considered as outliers. In this case, the mean of these data is

Note that the mean of 47.875 is much larger than the median of 16.5. It is obvious that the mean of these data has been adversely affected by the outliers. Hence, in this case, the mean does not adequately represent the measure of centrality of the data set, so that the median would more accurately identify the location of the center of the data.
Furthermore, if we replace the extreme values of 250 and 300, for example, by 25 and 30, respectively, then the median will not change, whereas the mean becomes 16.937, namely $16,937. Thus, the new data obtained by replacing the values 250 and 300 with 25 and 30, respectively, do not contain any outliers. The new mean value is more consistent with the true average sales.
Weighted Mean
Sometimes, we are interested in finding the sample average of a data set where each observation is given a relative importance expressed numerically by a set of values called weights. We illustrate the concept of weighted mean with the following example.
Example 2.5.5(GPA data) Elizabeth took five courses in a given semester with 5, 4, 3, 3, and 2 credit hours. The grade points she earned in these courses at the end of the semester were 3.7, 4.0, 3.3, 3.7, and 4.0, respectively. Find her GPA for that semester.
Solution:Note that in this example, the data points 3.7, 4.0, 3.3, 3.7, and 4.0 have different weights attached to them; that is, the weights are the credit hours for each course. Thus, to find Elizabeth's GPA, we cannot simply find the arithmetic mean. Rather, in this case, we need to find the mean called the weighted mean , which is defined as
(2.5.4) 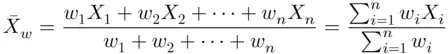
Интервал:
Закладка:
Похожие книги на «Statistics and Probability with Applications for Engineers and Scientists Using MINITAB, R and JMP»
Представляем Вашему вниманию похожие книги на «Statistics and Probability with Applications for Engineers and Scientists Using MINITAB, R and JMP» списком для выбора. Мы отобрали схожую по названию и смыслу литературу в надежде предоставить читателям больше вариантов отыскать новые, интересные, ещё непрочитанные произведения.


Обсуждение, отзывы о книге «Statistics and Probability with Applications for Engineers and Scientists Using MINITAB, R and JMP» и просто собственные мнения читателей. Оставьте ваши комментарии, напишите, что Вы думаете о произведении, его смысле или главных героях. Укажите что конкретно понравилось, а что нет, и почему Вы так считаете.