Bhisham C. Gupta - Statistics and Probability with Applications for Engineers and Scientists Using MINITAB, R and JMP
Здесь есть возможность читать онлайн «Bhisham C. Gupta - Statistics and Probability with Applications for Engineers and Scientists Using MINITAB, R and JMP» — ознакомительный отрывок электронной книги совершенно бесплатно, а после прочтения отрывка купить полную версию. В некоторых случаях можно слушать аудио, скачать через торрент в формате fb2 и присутствует краткое содержание. Жанр: unrecognised, на английском языке. Описание произведения, (предисловие) а так же отзывы посетителей доступны на портале библиотеки ЛибКат.

- Название:Statistics and Probability with Applications for Engineers and Scientists Using MINITAB, R and JMP
- Автор:
- Жанр:
- Год:неизвестен
- ISBN:нет данных
- Рейтинг книги:4 / 5. Голосов: 1
-
Избранное:Добавить в избранное
- Отзывы:
-
Ваша оценка:
Statistics and Probability with Applications for Engineers and Scientists Using MINITAB, R and JMP: краткое содержание, описание и аннотация
Предлагаем к чтению аннотацию, описание, краткое содержание или предисловие (зависит от того, что написал сам автор книги «Statistics and Probability with Applications for Engineers and Scientists Using MINITAB, R and JMP»). Если вы не нашли необходимую информацию о книге — напишите в комментариях, мы постараемся отыскать её.
Statistics and Probability with Applications for Engineers and Scientists using MINITAB, R and JMP, Second Edition Features two new chapters—one on Data Mining and another on Cluster Analysis Now contains R exhibits including code, graphical display, and some results MINITAB and JMP have been updated to their latest versions Emphasizes the p-value approach and includes related practical interpretations Offers a more applied statistical focus, and features modified examples to better exhibit statistical concepts Supplemented with an Instructor's-only solutions manual on a book’s companion website
is an excellent text for graduate level data science students, and engineers and scientists. It is also an ideal introduction to applied statistics and probability for undergraduate students in engineering and the natural sciences.
Statistics and Probability with Applications for Engineers and Scientists Using MINITAB, R and JMP — читать онлайн ознакомительный отрывок
Ниже представлен текст книги, разбитый по страницам. Система сохранения места последней прочитанной страницы, позволяет с удобством читать онлайн бесплатно книгу «Statistics and Probability with Applications for Engineers and Scientists Using MINITAB, R and JMP», без необходимости каждый раз заново искать на чём Вы остановились. Поставьте закладку, и сможете в любой момент перейти на страницу, на которой закончили чтение.
Интервал:
Закладка:
| Frequency | Percentage | Cum.Frequency | Cum.Percentage | |
 |
3.00 | 7.69 | 3.00 | 7.69 |
 |
7.00 | 17.95 | 10.00 | 25.64 |
 |
8.00 | 20.51 | 18.00 | 46.15 |
 |
7.00 | 17.95 | 25.00 | 64.10 |
 |
6.00 | 15.38 | 31.00 | 79.49 |
 |
8.00 | 20.51 | 39.00 | 100.00 |
PRACTICE PROBLEMS FOR SECTION 2.3
1 The following data give the results of a customer sample survey for product satisfaction conducted by a manufacturing company. The numbers 1, 2, 3, 4, and 5 represent the satisfaction levels: very satisfied, fairly satisfied, neutral, fairly unsatisfied, and very unsatisfied, respectively.11334243151224112442542213445523232324431515411152Prepare a frequency distribution table.Determine the percentages for all categories.What percentage of the customers in this sample survey was very satisfied or fairly satisfied?
2 An engineering school arranged a charity concert to raise funds for Iraq war veterans. The following data give the status of 40 randomly selected students who attended the concert. The numbers 1, 2, 3, and 4 represent the categories freshman, sophomore, junior, and senior, respectively.2341121132133444113233333433342322314223Prepare a frequency distribution table.Determine the percentages for all categories.What percentage of the students in this sample survey were juniors or seniors?
3 The following data give the responses of 36 senior citizens who were asked about the engine size of their car. The numbers 1, 2, 3, 4, and 5 represent the five categories 3.5, 3.2, 3.0, 2.2, and 1.8L, respectively.545512111351542131323412215531521225Prepare a frequency distribution table.Determine the percentages for all categories.What percentage of the senior citizens drive cars of category 1 or 3?
4 A manufacturing company of condenser retaining bolts for car engines implemented a quality control system. As part of this quality control system, a team of engineers decided to record the number of nonconforming bolts produced in each shift. The following data show the number of nonconforming bolts during the past 45 shifts.253026262516212221271524192024163028242315152128181521272628171924262717271922271625163018Prepare a complete frequency distribution table, that is, a table having frequency, relative frequency, percentage, and cumulative frequency columns.
5 The following data give the number of graduate students admitted in all engineering programs of a prestigious university during the past 30 years (1976–2005).148167171177175165134177168142126166130122157138163129143145141162147141164137149146132157Prepare a complete frequency distribution table, that is, a table having frequency, relative frequency, percentage, and cumulative frequency columns.
6 A temperature‐sensing vacuum switch controls the vacuum that is applied to a vacuum motor operating a valve in the intake snorkel of the air cleaner. As the engine warms up, the temperature‐sensing unit shuts off the vacuum applied to the motor, allowing the valve to close so that heated air shuts off and outside cooler air is drawn into the engine. The following data give the temperatures (coded) at which the sensing unit shuts off the vacuum:105101120116108112118119107100107120113113101102102100101100118106114100104101107113110100109108100104110113118100119120Prepare a complete frequency distribution table, that is, a table having frequency, relative frequency, percentage, and cumulative frequency columns.
2.4 Graphical Description of Qualitative and Quantitative Data
2.4.1 Dot Plot
A dot plot is one of the simplest graphs. To construct this graph, the value of each observation is plotted on a real line. It provides visual information about the distribution of a single variable. For illustration, we consider the following example.
Example 2.4.1(Defective motors) The following data give the number of defective motors received in 20 different shipments:
| 8 | 12 | 10 | 16 | 10 | 25 | 21 | 15 | 17 | 5 |
| 26 | 21 | 29 | 8 | 6 | 21 | 10 | 17 | 15 | 13 |
Construct a dot plot for these data.
Solution:To construct a dot plot, draw a horizontal line with its scale beginning with a number less than the smallest observation and ending at a number greater than the largest observation. Then, construct the dot plot by plotting the given data points as shown in Figure 2.4.1.
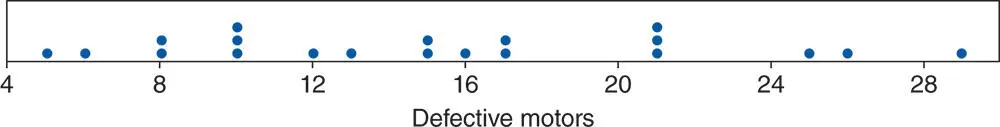
Figure 2.4.1Dot plot for the data on defective motors received in 20 different shipments.
Dot plots are more useful when the sample size is small. A dot plot gives us, for example, information about how the data are scattered and where most of the observations are concentrated. For instance, in this example, we see that the minimum number of defective motors and the maximum number of defective motors received in any shipment were 5 and 29, respectively. Also, we can see that 75% of the time, the number of defective motors was between 8 and 21 (inclusive) for these shipments, and so on.
2.4.2 Pie Chart
Pie charts are commonly used to describe qualitative data from one population. It is constructed by dividing a circle into various slices that represent different categories of a population. As examples: allocation of the federal budget by sector, revenues of a large manufacturing company by region or by plant, technicians in a large corporation who are classified according to their basic qualification: high‐school diploma, an associate degree, an undergraduate degree, a graduate degree, and so on. The pie chart helps us better understand at a glance the composition of the population with respect to the characteristic of interest.
To construct a pie chart, divide a circle into slices such that each slice representing a category is proportional to the size of that category. Since the total angle of a circle is 360°, the angle of a slice corresponding to a given category is determined as follows:
Читать дальшеИнтервал:
Закладка:
Похожие книги на «Statistics and Probability with Applications for Engineers and Scientists Using MINITAB, R and JMP»
Представляем Вашему вниманию похожие книги на «Statistics and Probability with Applications for Engineers and Scientists Using MINITAB, R and JMP» списком для выбора. Мы отобрали схожую по названию и смыслу литературу в надежде предоставить читателям больше вариантов отыскать новые, интересные, ещё непрочитанные произведения.


Обсуждение, отзывы о книге «Statistics and Probability with Applications for Engineers and Scientists Using MINITAB, R and JMP» и просто собственные мнения читателей. Оставьте ваши комментарии, напишите, что Вы думаете о произведении, его смысле или главных героях. Укажите что конкретно понравилось, а что нет, и почему Вы так считаете.