Bioinformatics
Здесь есть возможность читать онлайн «Bioinformatics» — ознакомительный отрывок электронной книги совершенно бесплатно, а после прочтения отрывка купить полную версию. В некоторых случаях можно слушать аудио, скачать через торрент в формате fb2 и присутствует краткое содержание. Жанр: unrecognised, на английском языке. Описание произведения, (предисловие) а так же отзывы посетителей доступны на портале библиотеки ЛибКат.
- Название:Bioinformatics
- Автор:
- Жанр:
- Год:неизвестен
- ISBN:нет данных
- Рейтинг книги:4 / 5. Голосов: 1
-
Избранное:Добавить в избранное
- Отзывы:
-
Ваша оценка:
Bioinformatics: краткое содержание, описание и аннотация
Предлагаем к чтению аннотацию, описание, краткое содержание или предисловие (зависит от того, что написал сам автор книги «Bioinformatics»). Если вы не нашли необходимую информацию о книге — напишите в комментариях, мы постараемся отыскать её.
“This book is a gem to read and use in practice.”
— "This volume has a distinctive, special value as it offers an unrivalled level of details and unique expert insights from the leading computational biologists, including the very creators of popular bioinformatics tools."
— “A valuable survey of this fascinating field. . . I found it to be the most useful book on bioinformatics that I have seen and recommend it very highly.”
— “This should be on the bookshelf of every molecular biologist.”
— The field of bioinformatics is advancing at a remarkable rate. With the development of new analytical techniques that make use of the latest advances in machine learning and data science, today’s biologists are gaining fantastic new insights into the natural world’s most complex systems. These rapidly progressing innovations can, however, be difficult to keep pace with.
The expanded fourth edition of the best-selling
aims to remedy this by providing students and professionals alike with a comprehensive survey of the current field. Revised to reflect recent advances in computational biology, it offers practical instruction on the gathering, analysis, and interpretation of data, as well as explanations of the most powerful algorithms presently used for biological discovery.
offers the most readable, up-to-date, and thorough introduction to the field for biologists at all levels, covering both key concepts that have stood the test of time and the new and important developments driving this fast-moving discipline forwards.
This new edition features:
New chapters on metabolomics, population genetics, metagenomics and microbial community analysis, and translational bioinformatics A thorough treatment of statistical methods as applied to biological data Special topic boxes and appendices highlighting experimental strategies and advanced concepts Annotated reference lists, comprehensive lists of relevant web resources, and an extensive glossary of commonly used terms in bioinformatics, genomics, and proteomics
is an indispensable companion for researchers, instructors, and students of all levels in molecular biology and computational biology, as well as investigators involved in genomics, clinical research, proteomics, and related fields.
Bioinformatics — читать онлайн ознакомительный отрывок
Ниже представлен текст книги, разбитый по страницам. Система сохранения места последней прочитанной страницы, позволяет с удобством читать онлайн бесплатно книгу «Bioinformatics», без необходимости каждый раз заново искать на чём Вы остановились. Поставьте закладку, и сможете в любой момент перейти на страницу, на которой закончили чтение.
Интервал:
Закладка:
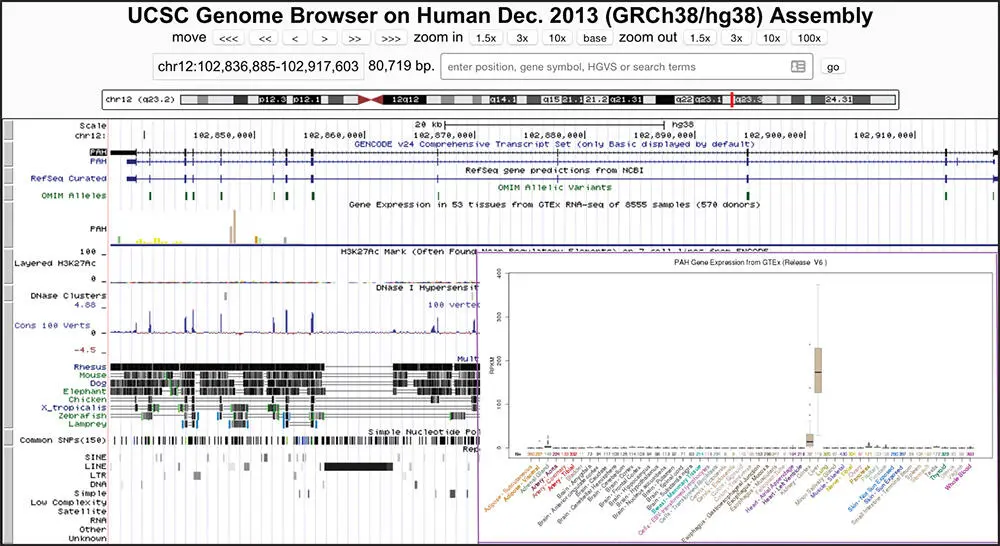
Figure 4.10 The GTEx Gene track, which depicts median gene expression levels in 51 tissues and two cell lines, based on RNA-seq data from the GTEx project from 8555 tissue samples. The main browser window depicts the GTEx Gene track for the human PAH gene, showing high expression in the two tissues colored brown (liver and kidney) but low or no expression in others. Clicking on the GTEx track opens it in a larger window, shown in the inset.
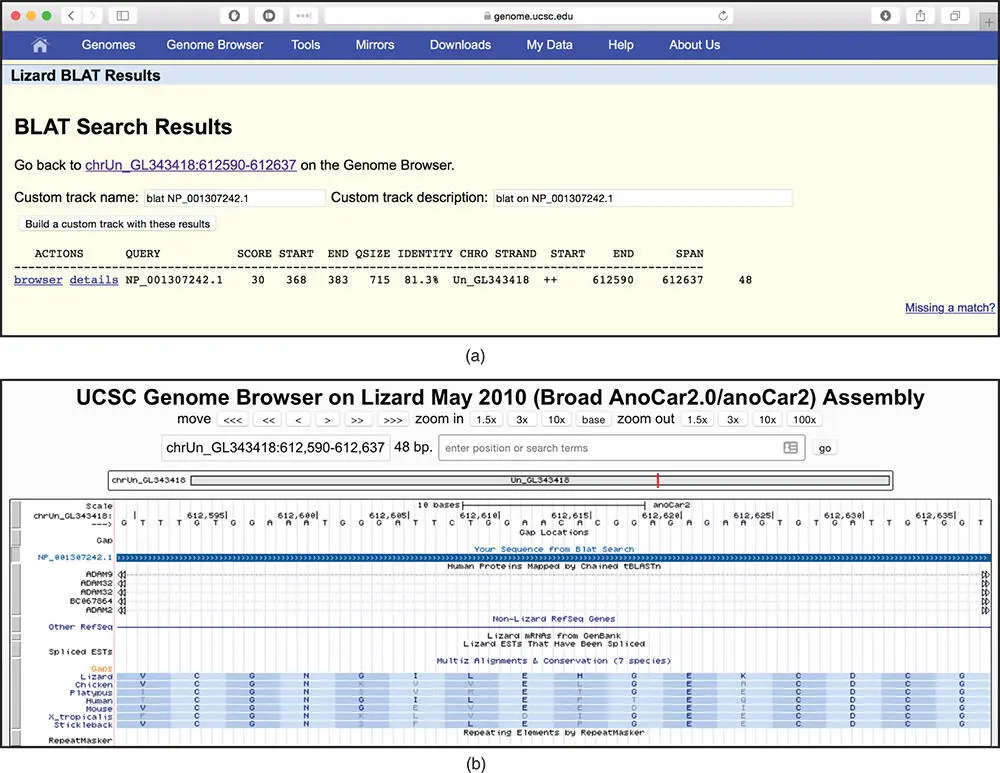
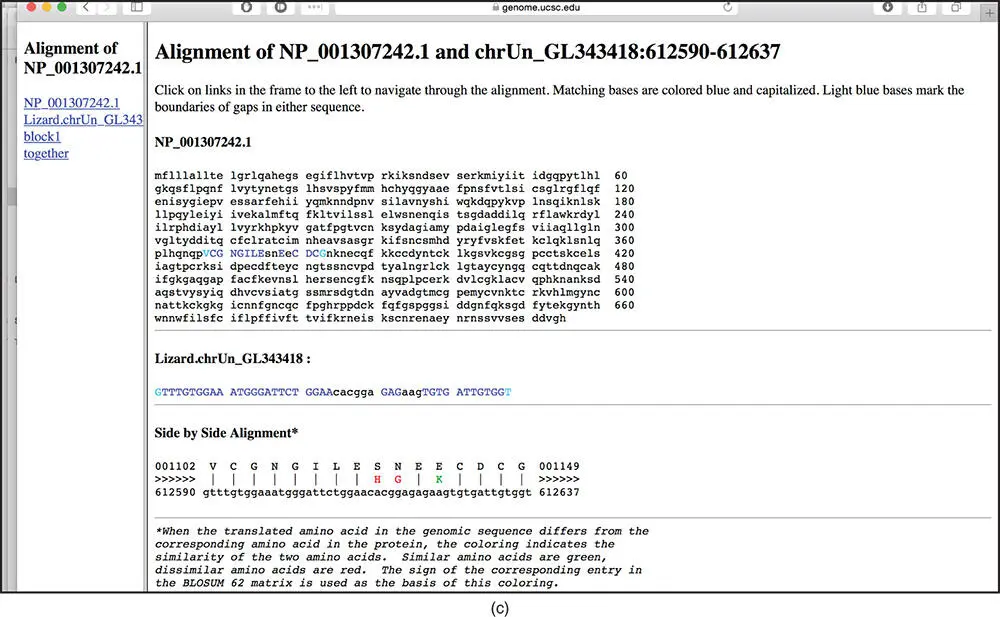
Figure 4.11 BLAT search at the UCSC Genome Browser. (a) This page shows the results of running a BLAT search against the lizard genome, using as a query the human protein sequence of the gene ADAM18 , accession NP_001307242.1. The ADAM18 protein sequence is available from NCBI at www.ncbi.nlm.nih.gov/protein/NP_001307242.1?report=fasta. At the UCSC Genome Browser, the web interface to the BLAT search is in the Tools menu at the top of each page. The BLAT search was run against the lizard genome assembly from May 2010, also called anoCar2. The columns on the results page are as follows: ACTIONS, links to the browser ( Figure 4.11b) and details ( Figure 4.11c); QUERY, the name of the query sequence; SCORE, the BLAT score, determined by the number of matches vs. mismatches in the final alignment of the query to the genome; START, the start coordinate of the alignment, on the query sequence; END, the end coordinate of the alignment, on the query sequence; QSIZE, the length of the query; IDENTITY, the percent identity between the query and the genomic sequences; CHRO, the chromosome to which the query sequence aligns; STRAND, the chromosome strand to which the query sequence aligns; START; the start coordinate of the alignment, on the genomic sequence; END, the end coordinate of the alignment, on the genomic sequence; and SPAN, the length of the alignment, on the genomic sequence. Note that, in this example, there is a single alignment; searches with other sequences may result in many alignments, each shown on a separate line. It is possible to search with up to 25 sequences at a time, but each sequence must be in FASTA format. (b) This page shows the browser link from the BLAT summary page. The alignment between the query and genome is shown as a new track called Your Sequence from BLAT Search . (c) The details link from the BLAT summary page, showing the alignment between the query (human ADAM18 protein) and the lizard genome, translated in six frames. The protein query sequence is shown at the top, with the blue letters indicating the amino acids that align to the genome. The bottom section shows the pairwise alignment between the protein and genomic sequence translated in six frames. Black lines indicate identical sequences; red and green letters indicate where the genomic sequence encodes a different amino acid. Although the ADAM18 protein sequence has a length of 715 amino acids, only 16 amino acids align as a single block to the lizard genome.
UCSC Table Browser
The Table Browser tool provides users a text-based interface with which to query, intersect, filter, and download the data that are displayed graphically in the Genome Browser. These data can then be saved in a spreadsheet for further analysis, or used as input into a different program. Using a web-based interface, users select a genome assembly, track, and position, then choose how to manipulate that track data and what fields to return. This example will demonstrate how to retrieve a list of all NCBI mRNA reference sequences that overlap with an SNP from the Genome-Wide Association Study ( GWAS ) Catalo g track, which identifies genetic loci associated with common diseases or traits. The GWAS Catalog is a manually curated collection of published genome-wide association studies that assayed at least 100 000 SNPs, in which all SNP-trait associations have p values of <1 × 10 −5(Buniello et al. 2019).
The Table Browser landing page is accessible from either the UCSC Genome Browser home page or the Tools pull-down menu. First, reset all user cart settings by clicking on the click here link at the bottom of the Table Browser settings section.
Then, select the NCBI RefSeq track on the GRCh38 genome assembly ( Figure 4.12a). Create a filter to limit the search to curated mRNA reference sequences in the NM_ accession series (Box 1.2; Figure 4.12b). Next, intersect the RefSeq track with variants from the GWAS Catalog ( Figure 4.12c). Finally, on the Table Browser form, change the output format to hyperlinks to Genome Browser , then click get output . The output is a list of 3000+ RefSeq mRNAs that overlap with a variant from the GWAS Catalog ( Figure 4.12d). The Genome Browser view of one of the transcripts, from the gene arginine–glutamic acid dipeptide (RE) repeats (RERE), and the six SNPs from the GWAS Catalog that it overlaps, can be found by clicking on the first link in the results list and is shown in Figure 4.12e.
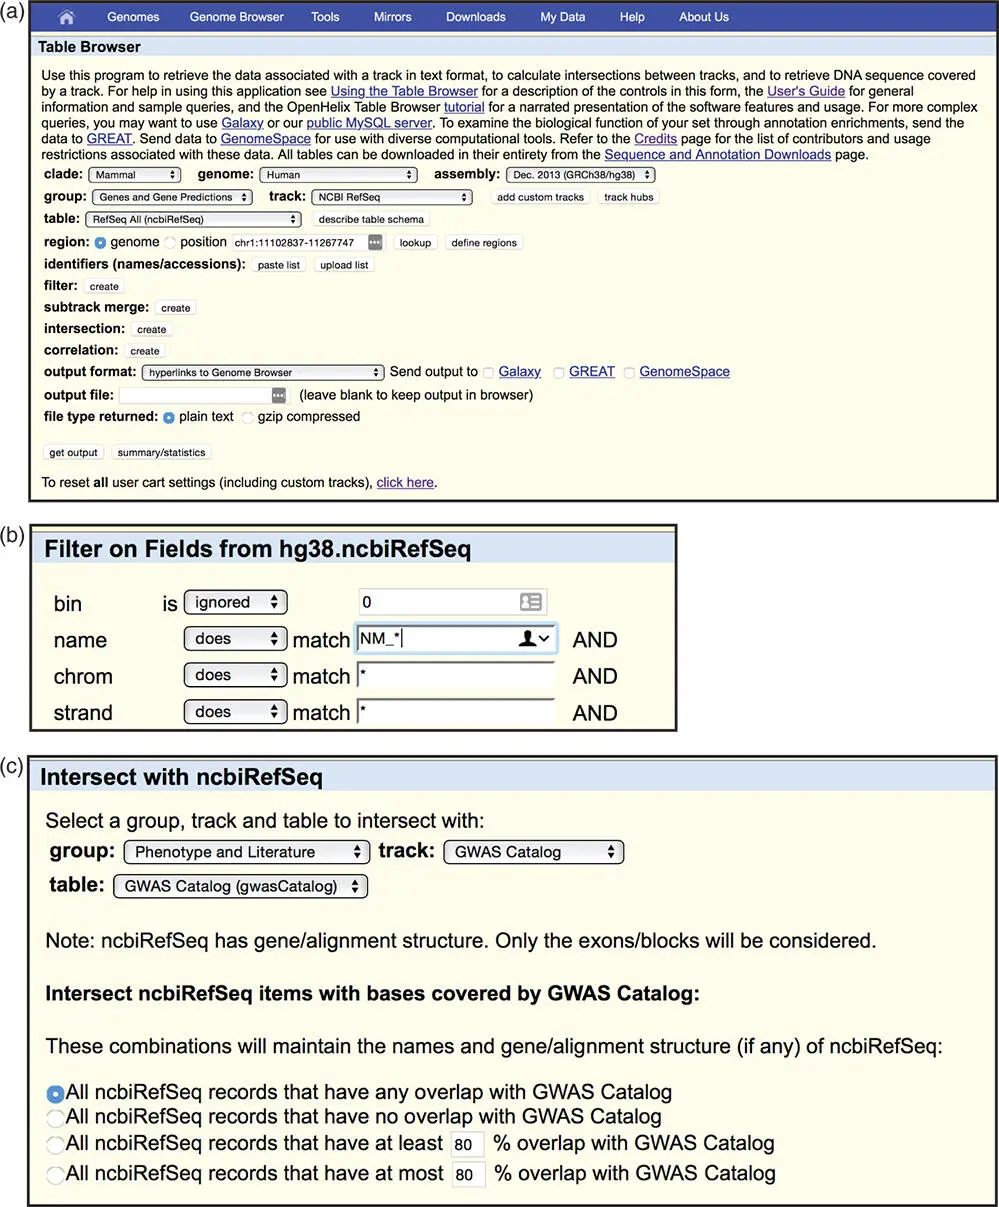
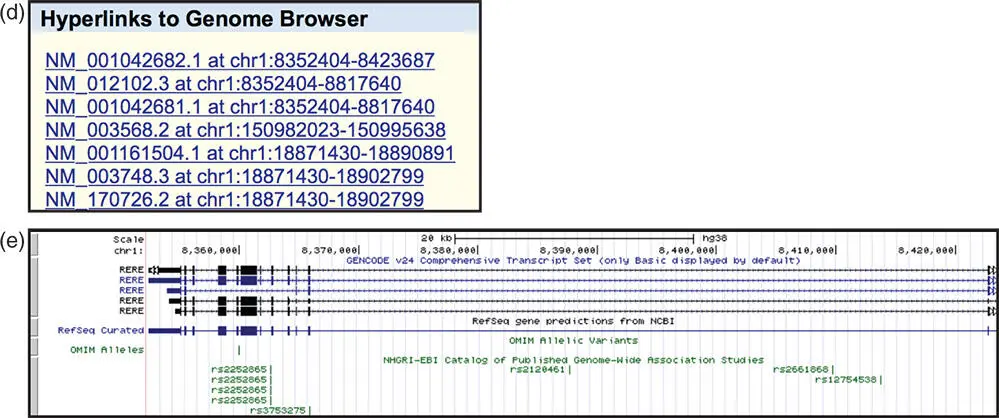
Figure 4.12 Configuring the UCSC Table Browser. The link to the Table Browser is in the Tools menu at the top of each page. (a) On the Table Browser home page, first reset all previous selections by clicking on the reset button at the bottom of the window. Next, select the track called NCBI RefSeq in the group Genes and Gene Predictions on the human GRCh38 genome assembly. The region should be set to genome and the output format to hyperlinks to Genome Browser . (b) Create a filter to limit the search to curated mRNA reference sequences in the NM_ accession series (see Box 1.2). Click on the filter button shown in Figure 4.12aand enter the term NM_*in the name field. The asterisk is a wildcard character that matches any text. Thus, this setting will limit the results to those curated RefSeqs whose name contains the term NM_. (c) Create an intersection between the RefSeq track and the variants from the GWAS Catalog. Click on the intersection button shown in Figure 4.12aand select the appropriate track. The group is Phenotype and Literature and the track is called GWAS Catalog . Leave other selections set to the default. (d) Click on the get output button shown in Figure 4.12a. The output is a list of more than 3000 RefSeq mRNAs that overlap with a variant from the GWAS Catalog. Each RefSeq is hyperlinked to the Genome Browser. (e) The first link is to NM_001042682.1, a transcript of the gene arginine–glutamic acid dipeptide (RE) repeats (RERE). The genomic context of RERE shows the eight SNPs from the GWAS Catalog that it overlaps.
UCSC also provides a related tool called the Data Integrator . The Data Integrator has a more sophisticated intersection function than does the Table Browser, as it can intersect data from up to five separate tracks, and output fields from both the selected tracks and related tables. Thus, for example, output from the Data Integrator could include the gene symbol in addition to the accession number for each transcript on the RefSeq track, along with the dbSNP identifier for the variants in the GWAS Catalog. However, the Data Integrator does not allow for filtering, so it is not possible to restrict the output to only RefSeq mRNA genes.
Читать дальшеИнтервал:
Закладка:
Похожие книги на «Bioinformatics»
Представляем Вашему вниманию похожие книги на «Bioinformatics» списком для выбора. Мы отобрали схожую по названию и смыслу литературу в надежде предоставить читателям больше вариантов отыскать новые, интересные, ещё непрочитанные произведения.


Обсуждение, отзывы о книге «Bioinformatics» и просто собственные мнения читателей. Оставьте ваши комментарии, напишите, что Вы думаете о произведении, его смысле или главных героях. Укажите что конкретно понравилось, а что нет, и почему Вы так считаете.