Bioinformatics
Здесь есть возможность читать онлайн «Bioinformatics» — ознакомительный отрывок электронной книги совершенно бесплатно, а после прочтения отрывка купить полную версию. В некоторых случаях можно слушать аудио, скачать через торрент в формате fb2 и присутствует краткое содержание. Жанр: unrecognised, на английском языке. Описание произведения, (предисловие) а так же отзывы посетителей доступны на портале библиотеки ЛибКат.

- Название:Bioinformatics
- Автор:
- Жанр:
- Год:неизвестен
- ISBN:нет данных
- Рейтинг книги:4 / 5. Голосов: 1
-
Избранное:Добавить в избранное
- Отзывы:
-
Ваша оценка:
Bioinformatics: краткое содержание, описание и аннотация
Предлагаем к чтению аннотацию, описание, краткое содержание или предисловие (зависит от того, что написал сам автор книги «Bioinformatics»). Если вы не нашли необходимую информацию о книге — напишите в комментариях, мы постараемся отыскать её.
“This book is a gem to read and use in practice.”
— "This volume has a distinctive, special value as it offers an unrivalled level of details and unique expert insights from the leading computational biologists, including the very creators of popular bioinformatics tools."
— “A valuable survey of this fascinating field. . . I found it to be the most useful book on bioinformatics that I have seen and recommend it very highly.”
— “This should be on the bookshelf of every molecular biologist.”
— The field of bioinformatics is advancing at a remarkable rate. With the development of new analytical techniques that make use of the latest advances in machine learning and data science, today’s biologists are gaining fantastic new insights into the natural world’s most complex systems. These rapidly progressing innovations can, however, be difficult to keep pace with.
The expanded fourth edition of the best-selling
aims to remedy this by providing students and professionals alike with a comprehensive survey of the current field. Revised to reflect recent advances in computational biology, it offers practical instruction on the gathering, analysis, and interpretation of data, as well as explanations of the most powerful algorithms presently used for biological discovery.
offers the most readable, up-to-date, and thorough introduction to the field for biologists at all levels, covering both key concepts that have stood the test of time and the new and important developments driving this fast-moving discipline forwards.
This new edition features:
New chapters on metabolomics, population genetics, metagenomics and microbial community analysis, and translational bioinformatics A thorough treatment of statistical methods as applied to biological data Special topic boxes and appendices highlighting experimental strategies and advanced concepts Annotated reference lists, comprehensive lists of relevant web resources, and an extensive glossary of commonly used terms in bioinformatics, genomics, and proteomics
is an indispensable companion for researchers, instructors, and students of all levels in molecular biology and computational biology, as well as investigators involved in genomics, clinical research, proteomics, and related fields.
Bioinformatics — читать онлайн ознакомительный отрывок
Ниже представлен текст книги, разбитый по страницам. Система сохранения места последней прочитанной страницы, позволяет с удобством читать онлайн бесплатно книгу «Bioinformatics», без необходимости каждый раз заново искать на чём Вы остановились. Поставьте закладку, и сможете в любой момент перейти на страницу, на которой закончили чтение.
Интервал:
Закладка:
The default human gene set used by Ensembl is the GENCODE Comprehensive set ( Box 4.2). Ensembl displays 18 PAH isoforms, each with a slightly different pattern of exons ( Figure 4.16). Coding exons are depicted as solid blocks, non-coding exons as outlined blocks, and introns are the lines that connect them. The transcripts are color coded to indicate their status: gold transcripts are protein coding and have been annotated by both the Ensembl and HAVANA team at the WTSI, red transcripts are protein coding and have been annotated by either Ensembl or HAVANA, and blue transcripts are processed transcripts that are non-protein coding. Clicking on a transcript pops up a box with additional information about that feature, including its accession number, and, for a transcript, the transcript type and gene prediction source ( Box 4.4; Figure 4.16).
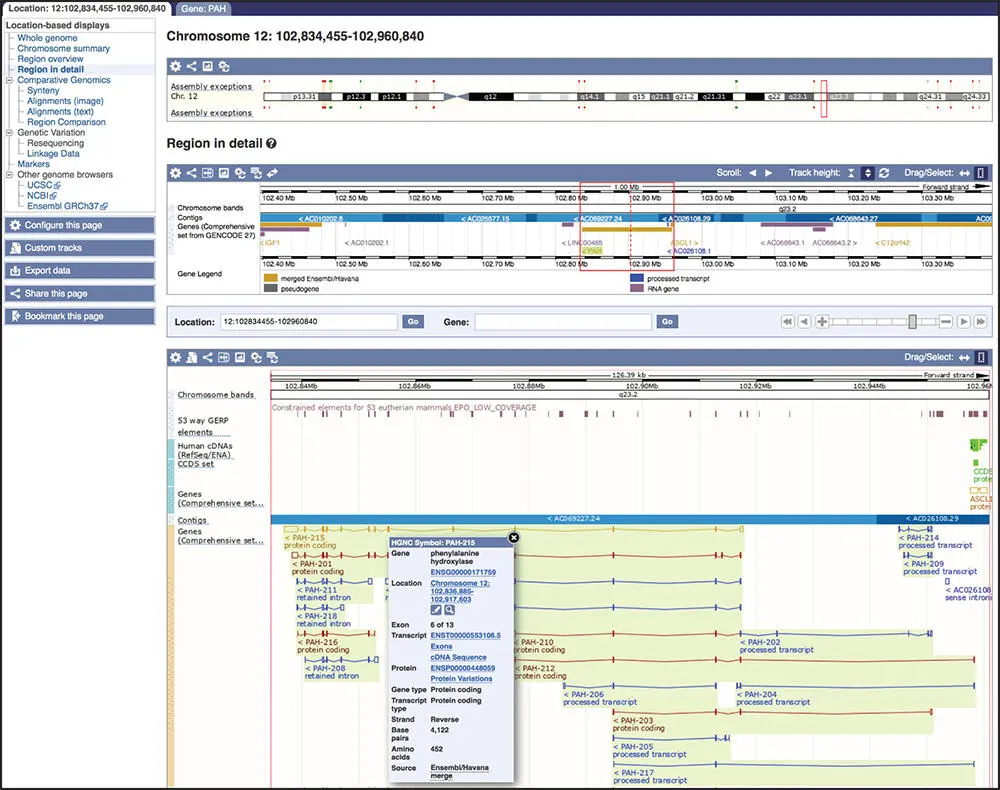
Figure 4.16 The Location tab for the human PAH gene. The Location tab is divided into three sections. The top section shows a cartoon of human chromosome 12, with the region surrounding the PAH gene outlined in a red box. Other red and green lines on the cartoon indicate assembly exceptions, or regions of alternative sequence that differ from the primary assembly because of allelic sequence or incorrect sequence, as determined by the Genome Reference Consortium. The Region in detail shows a zoomed-in view of the region outlined by the red box in the top section of the page. Genes are indicated by rectangles, colored as described in the gene legend below the graphic. The gene identifiers, along with the direction of transcription, are shown below the rectangles. The bottom section shows a zoomed-in view of the region surrounded by the red box in the Region in detail . The blue bar represents the genomic contig in this region. In the Genes track, genes above the bar are transcribed from left to right; those below the contig are transcribed from right to left. A few of the PAH transcripts, which are transcribed from right to left, are visible in this view. Gold transcripts are merged HAVANA/Ensembl transcripts; red are Ensembl protein-coding transcripts; blue transcripts are non-protein-coding processed transcripts. The pop-up display, activated when clicking on a particular transcript, shows the details for the first transcript in the Genes track, PAH-215 .
Box 4.4Ensembl Stable IDs
Ensembl assigns accession numbers to many data types in its database. Each identifier begins with the organism prefix; for human, the prefix is ENS; for mouse, it is ENSMUS; and for anole lizard, it is ENSACA.Next comes an abbreviation for the feature type: Gfor gene, Tfor transcript, Pfor protein, Rfor regulatory, and so forth. This is followed by a series of digits, and an optional version. The version number increments when there is a change in the underlying data. The gene version changes when the underlying transcripts are updated, and the transcript and protein versions increment when the sequence changes.
For example, the human PAH gene has the following identifiers:
ENSG00000171759.9: the identifier of the human PAH gene
ENST00000553106.5: the identifier of one transcript of the human PAH gene, transcript PAH-215
ENSP00000448059.1: the identifier of the protein translation of transcript PAH-215, ENST00000553106.5
ENSR00000056420: the identifier of a promoter of several PAH transcripts
Navigation controls between the second and third panels of the Location tab allow the display to be zoomed or moved to the left or right. The blue bar at the top of the Region in detail allows users to toggle between Drag and Select . When the Drag option is highlighted, click on the graphical view window and drag it to the left or right to change the location. When the Select option is highlighted, click on a region of interest in the graphical view, then, holding the mouse button down, scroll to the left or right to highlight the region ( Figure 4.17a). The highlight can be left on for visualization purposes or, alternatively, select Jump to region to zoom in to the selected region. Figure 4.17bshows the results of zooming in to the last exon of transcript PAH-203 ; since the gene is transcribed from right to left, the last exon is on the left. Note the track called All phenotype-associated short variants (SNPs and indels) that contains those variants that have been associated with a phenotype or disease. SNPs are color coded by function, with dark green indicating coding sequence variants. Select the dark green SNP, highlighted with a red box near the left end of the window, and follow the link for additional information. The resulting Variant tab provides links to SNP-related resources. For example, the Phenotype Data for this SNP (rs76296470; Figure 4.18a) shows that this variant is pathogenic and is associated with the disease phenylketonuria. The most severe consequence for this SNP is a stop gained . Further details about the consequences are available under the Genes and regulation link ( Figure 4.18b) on the left sidebar. This variant is found in 10 transcripts of the PAH gene. In five of those transcripts, it alters one nucleotide in a codon, changing an arginine to a stop codon, thus truncating the PAH protein. In the other five transcripts, either the variant is downstream of the gene or the transcript is non-coding.
Ensembl makes available many annotation tracks through the Configure this page link on the left sidebar. There are over 500 tracks available for display on GRCh38, with the majority falling in the categories of Variation, Regulation, and Comparative Genomics. The Ensembl Regulatory Build includes regions that are likely to be involved in gene regulation, including promoters, promoter flanking regions, enhancers, CCCTC-binding factor (CTCF) binding sites, transcription factor binding sites (TFBS), and open chromatin regions (Zerbino et al. 2016). A summary Regulatory Build track is turned on by default in the Location tab, and the display of individual features can be adjusted in the Configure this page menu. In the UCSC Genome Browser, the GTEx track shows that the PAH gene is highly expressed in liver and kidney ( Figure 4.10); the epigenetic factors that may be controlling this activity can be viewed in Ensembl Regulatory Build . To view these factors, navigate to Regulation → Histones & polymerases on the Configure this page menu, mouse over the HepG2 human liver carcinoma line, and select All features for HepG2 ( Figure 4.19a). In addition, navigate to Regulation → Open chromatin & TFBS and confirm that the DNase1 track is in its default state for HepG2; the dark blue indicates that the track is shown . Close the Configure this page menu by clicking on the check mark in the upper right corner of the pop-up window. Notice that the Regulatory Build track has now expanded to include the selected gene regulatory marks in the HepG2 cell line. Zoom in on the first exon of transcript PAH-215 to see the promoter region of this gene, being mindful of the orientation of the gene ( Figure 4.19b). The solid red rectangle in the Regulatory Build track shows the location of the PAH promoter. The presence of a DNaseI hypersensitive site along with the activating histone marks of H3K27Ac, H3K4me1, H3K4me2, H3K4me3, H3K79me2, and H3K9Ac may help to explain why this gene is highly expressed in liver cells ( Box 4.3). Detailed information about features in the Regulatory Build track, such as the source of the data, is available under the Regulation tab. Click on the feature and select its identifier (the letters ENSR, followed by numbers) to open this tab.
Читать дальшеИнтервал:
Закладка:
Похожие книги на «Bioinformatics»
Представляем Вашему вниманию похожие книги на «Bioinformatics» списком для выбора. Мы отобрали схожую по названию и смыслу литературу в надежде предоставить читателям больше вариантов отыскать новые, интересные, ещё непрочитанные произведения.


Обсуждение, отзывы о книге «Bioinformatics» и просто собственные мнения читателей. Оставьте ваши комментарии, напишите, что Вы думаете о произведении, его смысле или главных героях. Укажите что конкретно понравилось, а что нет, и почему Вы так считаете.