Prof. Lars O. Nord - Carbon Dioxide Emission Management in Power Generation
Здесь есть возможность читать онлайн «Prof. Lars O. Nord - Carbon Dioxide Emission Management in Power Generation» — ознакомительный отрывок электронной книги совершенно бесплатно, а после прочтения отрывка купить полную версию. В некоторых случаях можно слушать аудио, скачать через торрент в формате fb2 и присутствует краткое содержание. Жанр: unrecognised, на английском языке. Описание произведения, (предисловие) а так же отзывы посетителей доступны на портале библиотеки ЛибКат.
- Название:Carbon Dioxide Emission Management in Power Generation
- Автор:
- Жанр:
- Год:неизвестен
- ISBN:нет данных
- Рейтинг книги:5 / 5. Голосов: 1
-
Избранное:Добавить в избранное
- Отзывы:
-
Ваша оценка:
Carbon Dioxide Emission Management in Power Generation: краткое содержание, описание и аннотация
Предлагаем к чтению аннотацию, описание, краткое содержание или предисловие (зависит от того, что написал сам автор книги «Carbon Dioxide Emission Management in Power Generation»). Если вы не нашли необходимую информацию о книге — напишите в комментариях, мы постараемся отыскать её.
Carbon Dioxide Emission Management in Power Generation — читать онлайн ознакомительный отрывок
Ниже представлен текст книги, разбитый по страницам. Система сохранения места последней прочитанной страницы, позволяет с удобством читать онлайн бесплатно книгу «Carbon Dioxide Emission Management in Power Generation», без необходимости каждый раз заново искать на чём Вы остановились. Поставьте закладку, и сможете в любой момент перейти на страницу, на которой закончили чтение.
Интервал:
Закладка:
(1.1) 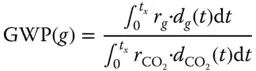
r gis the radiative forcing per unit mass increase in atmospheric abundance of component g , and d g (t) is the time-dependent abundance of g , and the corresponding quantities for the reference gas (CO 2) in the denominator. Radiative forcing is defined as the change in net irradiance at the tropopause. Net irradiance is the difference between the incoming radiation energy and the outgoing radiation energy in a given climate system and is measured in W/m 2. The GWP definition is time dependent ( t x), but, for any time horizon, the GWP of CO 2is unity by definition.
In Table 1.1, a list of some selected greenhouse gases and their GWP and atmospheric mean lifetime is given. Water vapour is not included in the list even though it is an important greenhouse gas because the presence of water vapour in the atmosphere is mainly determined by the temperature. The short atmospheric lifetime of tropospheric ozone (hours to days) precludes a globally homogeneous distribution and is consequently not included in Table 1.1. Ozone concentrations, and associated radiative effects, are highest near their sources. CO 2has an atmospheric lifetime that is difficult to specify precisely because CO 2is exchanged with reservoirs having a wide range of turnover times: 5–200 years or even much longer than that.
1.2 Atmospheric CO 2
The concentrations of carbon dioxide, methane, and other greenhouse gases are currently increasing over time. The carbon dioxide concentration, measured as the mole fraction in dry air, on Mauna Loa, Hawaii, constitutes the longest record of direct measurements of CO 2in the atmosphere. The average Mauna Loa CO 2level for 2017 was 407 ppmvd (based on the monthly averages) compared to 316 ppmvd in 1959. The measurements were started by C. David Keeling of the Scripps Institution of Oceanography in March of 1958 at a facility of the National Oceanic and Atmospheric Administration (Keeling et al. 1976). NOAA started its own CO 2measurements in May 1974, and they have run in parallel with those made by Scripps since then (Thoning et al. 1989).
Table 1.1 Global warming potential (GWP) – relative to CO 2– as well as atmospheric concentration and lifetime of selected greenhouse gases.
Source: Data are based on CDIAC (2010).
| Gas | Chemical formula | Recent tropospheric concentration | GWP (100 yr time horizon) | Atmospheric lifetime (yr) |
| Carbon dioxide | CO 2 | ≈386 ppm | 1 | 100 |
| Methane | CH 4 | ≈1800 ppb | 25 | 12 |
| Nitrous oxide | N 2O | ≈320 ppb | 298 | 114 |
| Ozone | O 3 | ≈34 ppb | N/A | h/d |
| CFC-11 | CCl 3F | ≈240 ppt | 4750 | 45 |
| CFC-12 | CCl 2F 2 | ≈536 ppt | 10 900 | 100 |
| CFC-113 | CCl 2FFClF 2 | ≈76 ppt | 6 130 | 85 |
| HCFC-22 | CHClF 2 | ≈200 ppt | 1 810 | 12 |
| HCFC-141b | CH 3CCl 2F | ≈20 ppt | 725 | 9 |
| HCFC-142b | CH 3CClF 2 | ≈20 ppt | 2 310 | 18 |
| Halon 1211 | CBrCIF 2 | ≈4 ppt | 1 890 | 16 |
| Halon 1301 | CBrCIF 3 | ≈3 ppt | 7 140 | 65 |
| HFC-134a | CH 2FCF 3 | ≈52 ppt | 1 430 | 14 |
| Carbon tetrachloride | CCL 4 | ≈88 ppt | 1 400 | 26 |
| Methyl chloroform | CH 3CCl 3 | ≈10 ppt | 146 | 5 |
| Sulfur hexafluoride | SF 6 | ≈7 ppt | 22 800 | 3200 |
For a much longer time frame, data from the Vostok ice core provide an insight into the variations in CO 2levels for the past four glacial–interglacial cycles. In January 1998, the collaborative ice-drilling project between Russia, the United States, and France at the Russian Vostok station in East Antarctica yielded the deepest ice core ever recovered, reaching a depth of 3623 m (Petit et al. 1999). Data from this project are displayed in Figure 1.1. One conclusion from the authors was that present-day atmospheric burdens of CO 2seem to have been unprecedented during the past 420 000 years. Note that the mean resolution for the CO 2measurements was about 1500 years.
1.3 Natural Accumulations and Emissions of CO 2
There are many examples of natural emissions of CO 2to the atmosphere. Forest fires and grass fires are natural phenomena, which release large amounts of CO 2to the atmosphere. On the other hand, after such fires, new trees and grass will grow and eventually bind more or less the same amount of CO 2as was released. One can say that as long as the total amount of biomass on a global basis is constant over a longer period of time, the combustion, decay, and growth of biomass is balanced with respect to CO 2. In this respect, the use of biomass for energy purposes can be regarded as CO 2 neutral . Consequently, if the amount of biomass is increasing through an expansion of the area covered by forests, this contributes to reducing the amount of CO 2in the atmosphere. In reality, there is a significant ongoing reduction in biomass globally by man-made forest fires and wood cutting, which contributes to about 20% of the annual increase in greenhouse gas emissions.
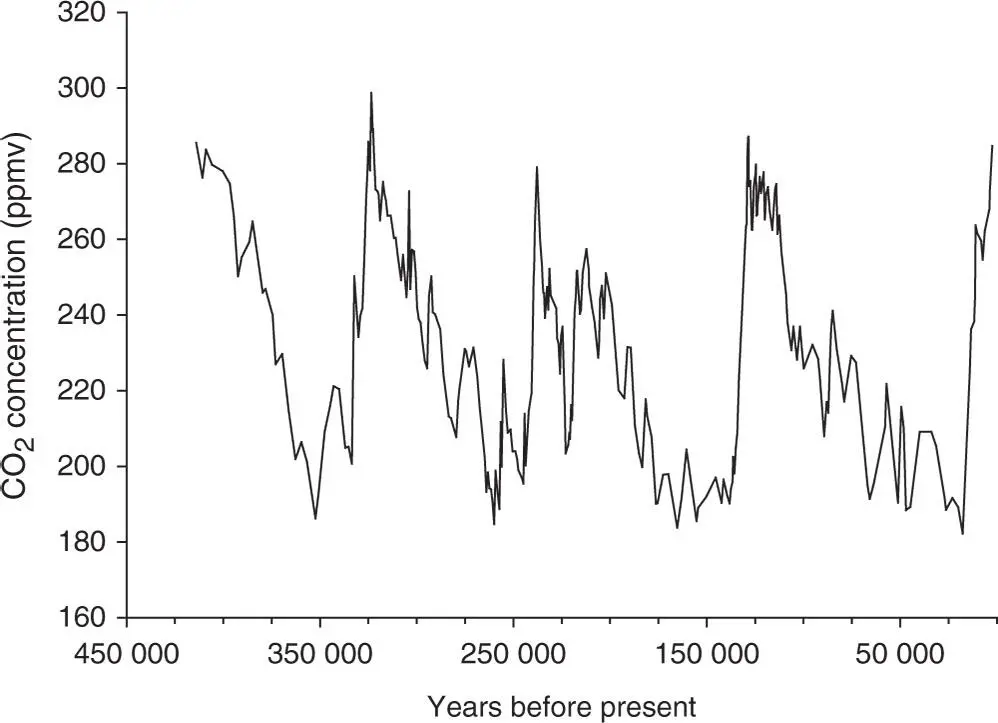
Figure 1.1 Vostok ice core data for 420 000 years. Atmospheric CO 2concentrations from trapped gas bubbles.
Source: Petit et al. (1999). Reproduced with permission of Springer Nature.
There are also a number of examples of seepage of CO 2from the ground. From many of the ground seepages, the flux is so small that it is hardly noticeable. Others have a high flux so that the ground-level concentration can cause death of plants through ‘root anoxia’ and even pose risks to human health and safety. At concentrations above about 2%, CO 2has a strong effect on respiratory physiology, and at concentrations above 7–10%, it can cause unconsciousness and death. Exposure studies have not revealed any adverse health effect from chronic exposure to concentrations below 1% (Fleming et al. 1992).
One important aspect to note about CO 2is that it has a higher molecular weight than air, meaning that it is denser than air. As a consequence, the release of CO 2at a low point in the terrain, with little or no wind, can cause the concentration at that point to increase to a very high level, as the CO 2will not be transported vertically by buoyancy.
Seepage of CO 2from the ground has a relevance to CO 2capture and storage because stored CO 2may leak out to the atmosphere. The impact on human health from releases of CO 2can be severe. Some examples are Lake Monoun, Lake Nyos, and Lake Kivu, which are the only three lakes in the world known to be saturated with CO 2(Clarke 2001; IEA-GHG 2006). The former two are located quite close to each other in the Oku Volcanic Field in Cameroon, whereas the latter is in Rwanda. In these lakes, the content of CO 2per volume of water increases with depth because the solubility of CO 2in water depends on the pressure, as can be seen in Figure 4.17.
On 15 August 1984, Lake Monoun exploded in a limnic eruption probably caused by an earthquake, which resulted in the release of a large amount of CO 2. As a direct consequence of the release, 37 people were killed. A gas cloud came up from a crater in the eastern part of the lake at night. The 37 people who died were residents in a low-lying area close to the lake. Survivors reported that the whitish, smoke-like cloud smelled bitter and acidic. The vegetation was flattened around the eastern part of the lake, probably by a water wave caused by the gas cloud.
Читать дальшеИнтервал:
Закладка:
Похожие книги на «Carbon Dioxide Emission Management in Power Generation»
Представляем Вашему вниманию похожие книги на «Carbon Dioxide Emission Management in Power Generation» списком для выбора. Мы отобрали схожую по названию и смыслу литературу в надежде предоставить читателям больше вариантов отыскать новые, интересные, ещё непрочитанные произведения.


Обсуждение, отзывы о книге «Carbon Dioxide Emission Management in Power Generation» и просто собственные мнения читателей. Оставьте ваши комментарии, напишите, что Вы думаете о произведении, его смысле или главных героях. Укажите что конкретно понравилось, а что нет, и почему Вы так считаете.