David W. Scott - Statistics
Здесь есть возможность читать онлайн «David W. Scott - Statistics» — ознакомительный отрывок электронной книги совершенно бесплатно, а после прочтения отрывка купить полную версию. В некоторых случаях можно слушать аудио, скачать через торрент в формате fb2 и присутствует краткое содержание. Жанр: unrecognised, на английском языке. Описание произведения, (предисловие) а так же отзывы посетителей доступны на портале библиотеки ЛибКат.
- Название:Statistics
- Автор:
- Жанр:
- Год:неизвестен
- ISBN:нет данных
- Рейтинг книги:5 / 5. Голосов: 1
-
Избранное:Добавить в избранное
- Отзывы:
-
Ваша оценка:
Statistics: краткое содержание, описание и аннотация
Предлагаем к чтению аннотацию, описание, краткое содержание или предисловие (зависит от того, что написал сам автор книги «Statistics»). Если вы не нашли необходимую информацию о книге — напишите в комментариях, мы постараемся отыскать её.
• Classical equally likely outcomes
• Variety of models of discrete and continuous probability laws
• Likelihood function and ratio
• Inference
• Bayesian statistics
With the growth in the volume of data generated in many disciplines that is enabling the growth in data science, companies now demand statistically literate scientists and this textbook is the answer, suited for undergraduates studying science or engineering, be it computer science, economics, life sciences, environmental, business, amongst many others. Basic knowledge of bivariate calculus, R language, Matematica and JMP is useful, however there is an accompanying website including sample R and Mathematica code to help instructors and students.
Statistics — читать онлайн ознакомительный отрывок
Ниже представлен текст книги, разбитый по страницам. Система сохранения места последней прочитанной страницы, позволяет с удобством читать онлайн бесплатно книгу «Statistics», без необходимости каждый раз заново искать на чём Вы остановились. Поставьте закладку, и сможете в любой момент перейти на страницу, на которой закончили чтение.
Интервал:
Закладка:
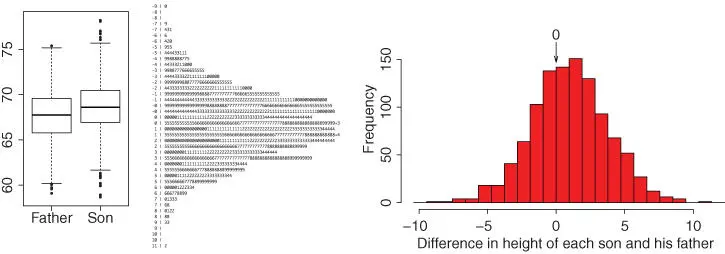
Figure 1.1 Displays of the father–son height data collected by Karl Pearson: (left) box‐and‐whiskers plot; (middle) stem‐and leaf plot; (right) histogram.
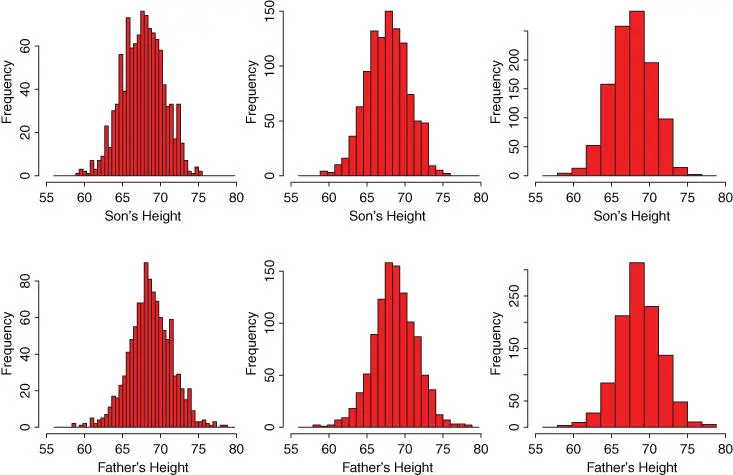
Figure 1.2 Histograms of the sons' heights (top row) and fathers' heights (bottom row) using three bin widths:  ,
,  ,
,  from left to right; see text.
1.1.2 Lord Rayleigh's Data
In Exploratory Data Analysis , Tukey (1977) demonstrates the box‐and‐whiskers plot using the Lord Rayleigh data, which measure the weight of nitrogen gas obtained by various means; see Table 1.1. Discrepancies in the results led to his discovery of the element argon. Rayleigh made  measurements from 1892 to 1894, with a mean of 2.30584 and a standard deviation of 0.00537. It is common to assume such measurements of a fundamental quantity are normally distributed. Multiple experiments are run and the results averaged in the presumption that a more accurate estimate will result.
Table 1.1 Lord Rayleigh's 24 measurements (sorted) of the weight of a sample of nitrogen. The first 10 came from chemical samples, while the last 14 came from pure air.
| 2.29816 | 2.29849 | 2.29869 | 2.29889 | 2.29890 |
| 2.29940 | 2.30054 | 2.30074 | 2.30143 | 2.30182 |
| 2.30956 | 2.30986 | 2.31001 | 2.31010 | 2.31010 |
| 2.31012 | 2.31017 | 2.31024 | 2.31024 | 2.31026 |
| 2.31027 | 2.31028 | 2.31035 | 2.31163 |
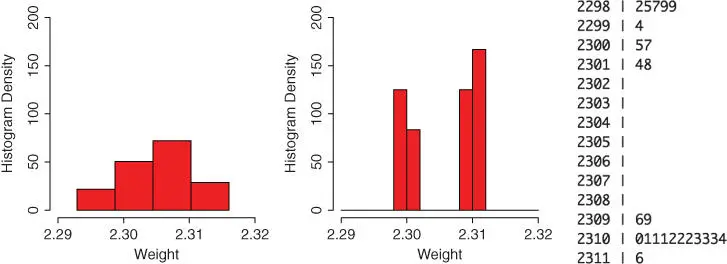
Figure 1.3 Displays of Lord Rayleigh's 24 measurements of the atomic weight of nitrogen gas. (Left) Histogram with four bins; (middle) a second histogram; (right) stem‐and‐leaf display using the  command
  .
.
In the left frame of Figure 1.3, we display a histogram with four (carefully selected) bins. The histogram is shown on a density scale, rather than a frequency scale, so that the area of the shaded region is 1. We shall see in Problem 1 that this is accomplished by dividing the bin counts by  .
.
The first histogram in Figure 1.3hides the interesting structure contained in the small dataset. The second histogram and stem‐and‐leaf plot show the two clusters quite clearly. Charting of data before the 1900s was not common, and looking at a table of the data would typically not reveal this feature. It turned out that Lord Rayleigh had combined various sources of the gas with several purifying agents and extraction methods. The samples originating from “pure air” were “contaminated” with argon. For the discovery of argon, Lord Rayleigh was awarded the Nobel Prize in Physics in 1904.
1.1.3 Discussion
Finding structure in data is a primary goal of data science. Graphical methods are powerful approaches to discovering unexpected or hidden structure. Some of these methods are better suited to small datasets. In a multivariate statistics course, we will learn how to analyze data with more than one variable. Modern genetic datasets often result in more than  variables!
1.2 Exploring Prediction Using Data
The second fundamental task of statistics is prediction. Data for this task are typically ordered pairs,  . The goal is to predict the value of the
  variable using the corresponding value of the
  variable. For example, we might try to predict a son's height (
  ) knowing the father's height (
  ). Or a bank contemplating a mortgage loan may use a person's credit score to predict the probability the person will default on the loan.
The initial step is to plot a scatter diagramof the  data points in order to determine if there is a strong relationship between
  and
and  . The relationship, if it exists, is linear or nonlinear. If knowledge of
  does not convey any information about the value of
  , then the scatter diagram will have no slope or trends, with
  values just scattered around their average.
1.2.1 Body and Brain Weights of Land Mammals
In the left frame of Figure 1.4, we plot the brain and body weights of 62 land mammals from the  MASS library. The relationship, if any, is hard to discern since 59 of the measurements are overplotted near the origin. We might choose to exclude the two elephant measurements and even the human data point as outliers, and then replot.
Интервал:
Закладка:
Похожие книги на «Statistics»
Представляем Вашему вниманию похожие книги на «Statistics» списком для выбора. Мы отобрали схожую по названию и смыслу литературу в надежде предоставить читателям больше вариантов отыскать новые, интересные, ещё непрочитанные произведения.


Обсуждение, отзывы о книге «Statistics» и просто собственные мнения читателей. Оставьте ваши комментарии, напишите, что Вы думаете о произведении, его смысле или главных героях. Укажите что конкретно понравилось, а что нет, и почему Вы так считаете.