David W. Scott - Statistics
Здесь есть возможность читать онлайн «David W. Scott - Statistics» — ознакомительный отрывок электронной книги совершенно бесплатно, а после прочтения отрывка купить полную версию. В некоторых случаях можно слушать аудио, скачать через торрент в формате fb2 и присутствует краткое содержание. Жанр: unrecognised, на английском языке. Описание произведения, (предисловие) а так же отзывы посетителей доступны на портале библиотеки ЛибКат.
- Название:Statistics
- Автор:
- Жанр:
- Год:неизвестен
- ISBN:нет данных
- Рейтинг книги:5 / 5. Голосов: 1
-
Избранное:Добавить в избранное
- Отзывы:
-
Ваша оценка:
Statistics: краткое содержание, описание и аннотация
Предлагаем к чтению аннотацию, описание, краткое содержание или предисловие (зависит от того, что написал сам автор книги «Statistics»). Если вы не нашли необходимую информацию о книге — напишите в комментариях, мы постараемся отыскать её.
• Classical equally likely outcomes
• Variety of models of discrete and continuous probability laws
• Likelihood function and ratio
• Inference
• Bayesian statistics
With the growth in the volume of data generated in many disciplines that is enabling the growth in data science, companies now demand statistically literate scientists and this textbook is the answer, suited for undergraduates studying science or engineering, be it computer science, economics, life sciences, environmental, business, amongst many others. Basic knowledge of bivariate calculus, R language, Matematica and JMP is useful, however there is an accompanying website including sample R and Mathematica code to help instructors and students.
Statistics — читать онлайн ознакомительный отрывок
Ниже представлен текст книги, разбитый по страницам. Система сохранения места последней прочитанной страницы, позволяет с удобством читать онлайн бесплатно книгу «Statistics», без необходимости каждый раз заново искать на чём Вы остановились. Поставьте закладку, и сможете в любой момент перейти на страницу, на которой закончили чтение.
Интервал:
Закладка:
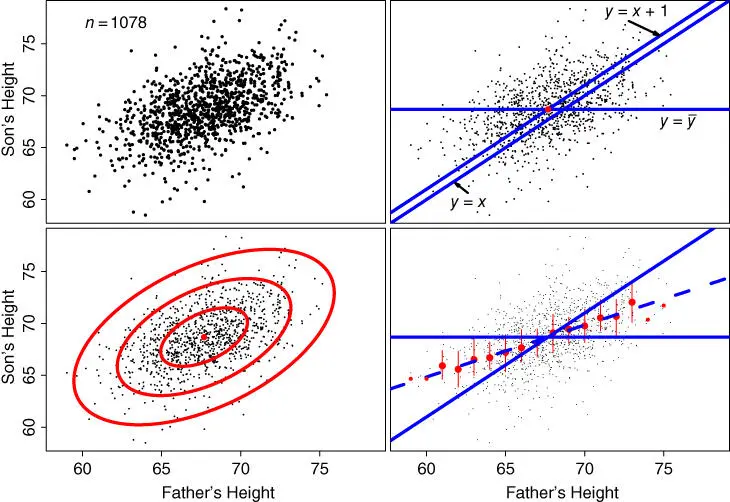
Figure 1.6 Father–son height data collected by Karl Pearson.
In the final frame, we take advantage of the large sample size to try to understand if the prediction (as weak as it may be) might be linear or nonlinear. For integer values of the rounded fathers' heights, we compute a three‐point summary of the corresponding sons' heights. The red dots are the arithmetic average of the sons' heights. The vertical lines display the (conditional) interquartile range. The final two red dots on each end are based on only a few points, so that the IQR can not be computed. These four red dots are shown in a smaller font size to indicate that even the averages are not so reliable.
We see that these summary points clearly suggest a linear rather than a nonlinear fit. We also see that the two blue reference lines from the second frame, namely  and
and  , both miss badly. A new (dashed) line with slope of 1/2 appears to capture the linear trend quite well. The relationship between this slope and the correlation coefficient, as well as a genetic explanation, will be discussed in Chapter 4.1.5.
1.2.4 Discussion
These rather substantial examples illustrate the search for structure in distribution and prediction problems, as well as practical problems and cures that may be encountered. A more formal statistical approach to these questions will be introduced in the third part of this course. Probability theory will be the theoretical basis for many of these models, so we make it the focus of the next few chapters.
Problems
1 1.1 A frequency histogram of continuous data is constructed by counting the number of data points that fall into equally spaced bins of width . is called the bin width. Typically the bin edges are 0, , , , and so on. If the bin count in the th bin is denoted by , then the frequency histogram is defined as(1.1) Show that the total area of the frequency histogram is , where . Hint: the histogram is made up of rectangular blocks of width and height .A probability histogram is defined to have total area of one. Show that the following definition of a histogram has area equal to one:(1.2)
2 1.2 One of the most famous epidemiological cases occurred in 1854 when Dr. John Snow successfully tracked down the source of an outbreak of cholera in the London suburb of SoHo. He mapped the households of some 500 victims over a 10‐day period that lived within a quarter of mile of each other. However, many tens of thousands had died of cholera in England during the prior two decades. Dr. Snow believed contaminated water was a primary cause. Just as in the Space Shuttle example, there are choices of an appropriate time interval and the geographical extent that can influence our conclusions. Using the descriptions and maps conveniently assembled at http://www.ph.ucla.edu/epi/snow/snowcricketarticle.html,discuss the evidence and choices that were and could have been made. Hint: these data have been conveniently collected in CRAN Library HistData by Friendly (2018). Look at the help file for dataset snow and its example code.
3 1.3The Tukey power transformation of a variable is for any non‐zero . To better understand why the is used in place of when , we consider the linear re‐expression of the Tukey transformation given by the formula (Box and Cox (1964)) (1.3)Since (1.3) is when , use l'Hôpital's rule to find the limit transformation as . The scatter diagram using either formula for fixed non‐zero will be visually identical. Formula (1.3) is referred to as the Box–Cox transformation; see Figure 1.7.Sometimes the transformation is used in place of when and can take on the value 0. In this case, the original and transformed values of 0 are both 0. Try this form on the body–brain data and compare to Figure 1.4. Figure 1.7 Box–Cox transformation on natural and log scales.
Конец ознакомительного фрагмента.
Текст предоставлен ООО «ЛитРес».
Прочитайте эту книгу целиком, на ЛитРес.
Безопасно оплатить книгу можно банковской картой Visa, MasterCard, Maestro, со счета мобильного телефона, с платежного терминала, в салоне МТС или Связной, через PayPal, WebMoney, Яндекс.Деньги, QIWI Кошелек, бонусными картами или другим удобным Вам способом.
Интервал:
Закладка:
Похожие книги на «Statistics»
Представляем Вашему вниманию похожие книги на «Statistics» списком для выбора. Мы отобрали схожую по названию и смыслу литературу в надежде предоставить читателям больше вариантов отыскать новые, интересные, ещё непрочитанные произведения.


Обсуждение, отзывы о книге «Statistics» и просто собственные мнения читателей. Оставьте ваши комментарии, напишите, что Вы думаете о произведении, его смысле или главных героях. Укажите что конкретно понравилось, а что нет, и почему Вы так считаете.