Philippe J. S. De Brouwer - The Big R-Book
Здесь есть возможность читать онлайн «Philippe J. S. De Brouwer - The Big R-Book» — ознакомительный отрывок электронной книги совершенно бесплатно, а после прочтения отрывка купить полную версию. В некоторых случаях можно слушать аудио, скачать через торрент в формате fb2 и присутствует краткое содержание. Жанр: unrecognised, на английском языке. Описание произведения, (предисловие) а так же отзывы посетителей доступны на портале библиотеки ЛибКат.
- Название:The Big R-Book
- Автор:
- Жанр:
- Год:неизвестен
- ISBN:нет данных
- Рейтинг книги:3 / 5. Голосов: 1
-
Избранное:Добавить в избранное
- Отзывы:
-
Ваша оценка:
The Big R-Book: краткое содержание, описание и аннотация
Предлагаем к чтению аннотацию, описание, краткое содержание или предисловие (зависит от того, что написал сам автор книги «The Big R-Book»). Если вы не нашли необходимую информацию о книге — напишите в комментариях, мы постараемся отыскать её.
The Big R-Book for Professionals: From Data Science to Learning Machines and Reporting with R Provides a practical guide for non-experts with a focus on business users Contains a unique combination of topics including an introduction to R, machine learning, mathematical models, data wrangling, and reporting Uses a practical tone and integrates multiple topics in a coherent framework Demystifies the hype around machine learning and AI by enabling readers to understand the provided models and program them in R Shows readers how to visualize results in static and interactive reports Supplementary materials includes PDF slides based on the book’s content, as well as all the extracted R-code and is available to everyone on a Wiley Book Companion Site
is an excellent guide for science technology, engineering, or mathematics students who wish to make a successful transition from the academic world to the professional. It will also appeal to all young data scientists, quantitative analysts, and analytics professionals, as well as those who make mathematical models.
The Big R-Book — читать онлайн ознакомительный отрывок
Ниже представлен текст книги, разбитый по страницам. Система сохранения места последней прочитанной страницы, позволяет с удобством читать онлайн бесплатно книгу «The Big R-Book», без необходимости каждый раз заново искать на чём Вы остановились. Поставьте закладку, и сможете в любой момент перейти на страницу, на которой закончили чтение.
Интервал:
Закладка:
readr expands R's standard 5 functionality to read in rectangular 6 data.readrIt is more robust, knows more data types and is faster than the core-R functionality. For more information, see Chapter 17.1.2 “Importing Flat Files in the Tidyverse” on page 267 and its subsections.
purrr is casually mentioned in the section about the OO model in R (see Chapter 6on page 87), and extensively used in Chapter 25.1 “Model Quality Measures” on page 476.purrrIt is a rather complete and consistent set of tools for working with functions and vectors. Using purrr it should be possible to replace most loops with call to purr functions that will work faster.
tibble is a new take on the data frame of core-R. It provides a new base type: tibbles.tibbleTibbles are in essence data frames, that do a little less (so there is less clutter on the screen and less unexpected things happen), but rather give more feedback (showwhat went wrong instead of assuming that you have read all manuals and remember everything). Tibbles are introduced in the next section.
stringr expands the standard functions to work with strings and provides a nice coherent set of functions that all start with str_.stringiThe package is built on top of stringi, which uses the ICU library that is written in C, so it is fast too. For more information, see Chapter 17.5 “String Manipulation in the tidyverse” on page 299.stringr
forcats provides tools to address common problems when working with categorical variables 7 .forcats
7.2.2 The Non-core Tidyverse
Besides the core tidyverse packages – that are loaded with the command library(tidyverse), there are many other packages that are part of the tidyverse. In this section we will describe briefly the most important ones.
Importing data: readxl for .xls and .xlsx files) and haven for SPSS, Stata, and SAS data. 8 readxlxlsxxls
Wrangling data: lubridate for dates and date-times, hms for time-of-day values, blob for storing binary data. lubridate –for example – is discussed in Chapter 17.6 “Dates with lubridate” on page 314.lubridatehmsblob
Programming: purrr for iterating within R objects, magrittr provides the famous pipe, %>% command plus some more specialised piping operators (like %$% and %<>%), and glue provides an enhancement to the paste() function.purrrmagrittrpaste()glue
Modelling: this is not really ready, though recipes and rsample are already operational and show the direction this is taking. The aim is to replace modelr 9 . Note that there is also the package broom that turns models into tidy data.recipesrsamplemodelrbroom
 Warning –Work in progress
While the core-tidyverse is stable, the packages that are not core tend still to change and improve. Check their online documentation when using them.
7.3. Working with the Tidyverse
7.3.1 Tibbles
Tibbles are in many aspects a special type of data frames. The do the same as data frames (i.e. store rectangular data), but they have some advantages.
Let us dive in and create a tibble. Imagine for example that we want to show the sum of the sine and cosine functions. The output of the code below is in Figure 7.1on this page.
x <- seq(from = 0, to = 2 *pi, length.out = 100) s <- sin(x) c <- cos(x) z <-s +c plot(x, z, type = “l”,col=“red”, lwd=7) lines(x, c, col = “blue”, lwd = 1.5) lines(x, s, col = “darkolivegreen”, lwd = 1.5) 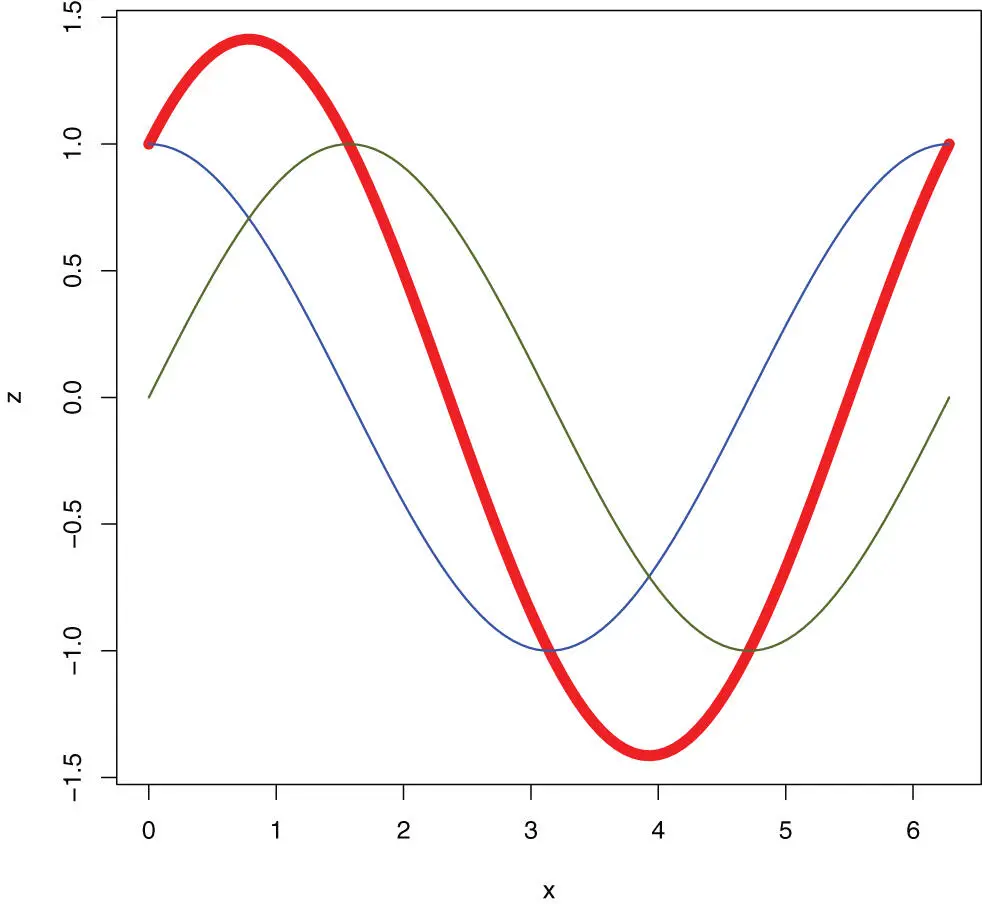
Figure 7.1 : The sum of sine and cosine illustrated .
Imagine further that our purpose is not only to plot these functions, but to use them in other applications. Then it would make sense to put them in a data, frame. The following code does exactly the same using a data frame.
x <- seq(from = 0, to = 2 *pi, length.out = 100) #df <- as.data.frame((x))df <- rbind( as.data.frame((x)), cos(x), sin(x), cos(x) + sin(x)) # plot etc.
This is already more concise. With the tidyverse, it would look as follows (still without using the piping):
library(tidyverse) x <- seq(from = 0, to = 2 *pi, length.out = 100) tb <- tibble(x, sin(x), cos(x), cos(x) + sin(x))
The code below first prints the tibble in the console and then plots the results in Figure 7.2on this page.
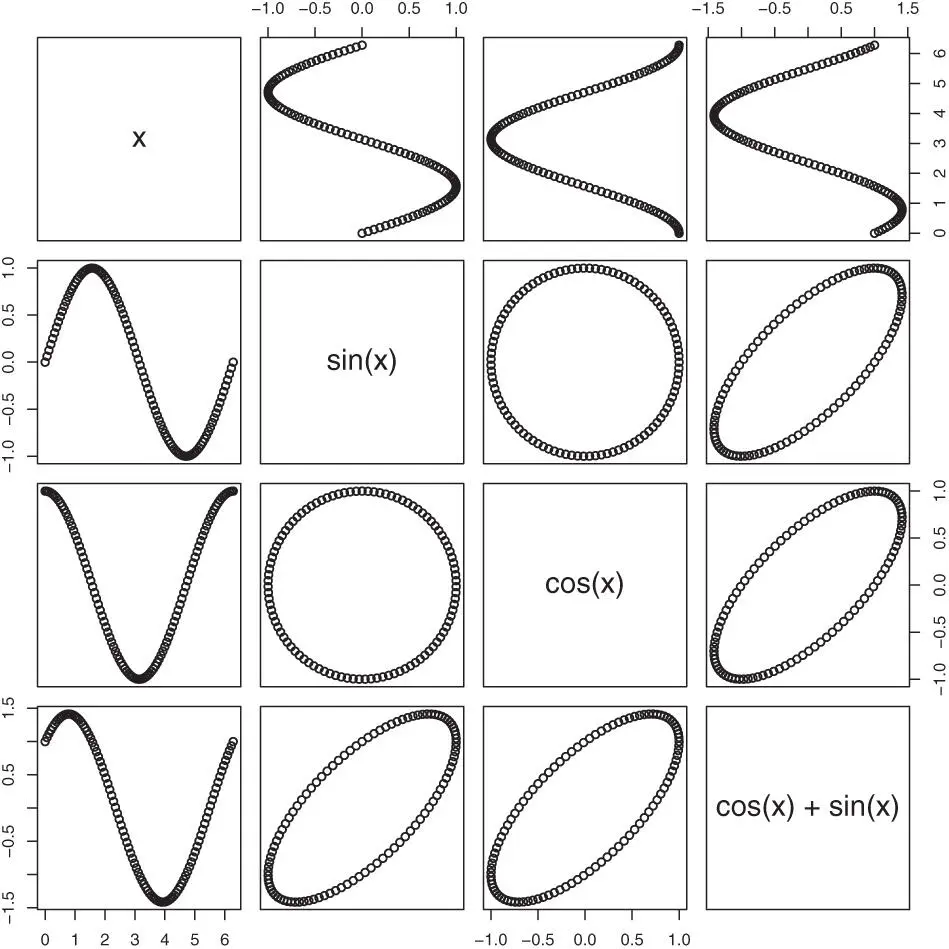
Figure 7.2: A tibble plots itself like a data-frame.
The code with a tibble is just a notch shorter, but that is not the point here. Themain advantage in using a tibble is that it will usually do things that make more sense for the modern R-user. For example, consider how a tibble prints itself (compared to what a data frame does).
# Note how concise and relevant the output is: print(tb) ## # A tibble: 100 x 4 ## x `sin(x)` `cos(x)` `cos(x) + sin(x)` ## ## 1 0 0 1 1 ## 2 0.0635 0.0634 0.998 1.06 ## 3 0.127 0.127 0.992 1.12 ## 4 0.190 0.189 0.982 1.17 ## 5 0.254 0.251 0.968 1.22 ## 6 0.317 0.312 0.950 1.26 ## 7 0.381 0.372 0.928 1.30 ## 8 0.444 0.430 0.903 1.33 ## 9 0.508 0.486 0.874 1.36 ## 10 0.571 0.541 0.841 1.38 ## # … with 90 more rows # This does the same as for a data-frame: plot(tb) # Actually a tibble will still behave as a data frame: is.data.frame(tb) ## [1] TRUE
Digression – Special characters in column names
Note the back-ticks in `sin(x)`when the tibble reports on itself. That is of course because in R variables are not allowed to use brackets in their names. The tibble does allow in the names of columns non-R-compliant variable names. To address this column by name, we need to refer to the column by its number or use back-ticks.
tb $`sin(x)`[1] ## [1] 0
This convention is not specific to tibbles, it is used throughout R (e.g. the same back-ticks are needed in ggplot2, tidyr, dyplr, etc.).
 Hint
Hint
Be aware of the saying “They have to recognize that great responsibility is an inevitable consequence of great power.” 10 It is not because you can do something that you must. Indeed, you can use a numeric column names in a tibble and the following is valid code.
tb <- tibble(`1` = 1 :3, `2` = sin(`1`), `1` *pi, 1 *pi) tb ## # A tibble: 3 x 4 ## `1` `2` `\`1\` * pi` `1 * pi` ## ## 1 1 0.841 3.14 3.14 ## 2 2 0.909 6.28 3.14 ## 3 3 0.141 9.42 3.14
However, is this good practice?
So, why use a tibble instead of a data frame?
1 It will do less things (such as changing strings into factors, creating row names, change names of variables, no partial matching, but a warning message when you try to access a column that does not exist, etc.).
Читать дальшеИнтервал:
Закладка:
Похожие книги на «The Big R-Book»
Представляем Вашему вниманию похожие книги на «The Big R-Book» списком для выбора. Мы отобрали схожую по названию и смыслу литературу в надежде предоставить читателям больше вариантов отыскать новые, интересные, ещё непрочитанные произведения.


Обсуждение, отзывы о книге «The Big R-Book» и просто собственные мнения читателей. Оставьте ваши комментарии, напишите, что Вы думаете о произведении, его смысле или главных героях. Укажите что конкретно понравилось, а что нет, и почему Вы так считаете.