Tamilvanan Shunmugaperumal - Oil-in-Water Nanosized Emulsions for Drug Delivery and Targeting
Здесь есть возможность читать онлайн «Tamilvanan Shunmugaperumal - Oil-in-Water Nanosized Emulsions for Drug Delivery and Targeting» — ознакомительный отрывок электронной книги совершенно бесплатно, а после прочтения отрывка купить полную версию. В некоторых случаях можно слушать аудио, скачать через торрент в формате fb2 и присутствует краткое содержание. Жанр: unrecognised, на английском языке. Описание произведения, (предисловие) а так же отзывы посетителей доступны на портале библиотеки ЛибКат.
- Название:Oil-in-Water Nanosized Emulsions for Drug Delivery and Targeting
- Автор:
- Жанр:
- Год:неизвестен
- ISBN:нет данных
- Рейтинг книги:5 / 5. Голосов: 1
-
Избранное:Добавить в избранное
- Отзывы:
-
Ваша оценка:
Oil-in-Water Nanosized Emulsions for Drug Delivery and Targeting: краткое содержание, описание и аннотация
Предлагаем к чтению аннотацию, описание, краткое содержание или предисловие (зависит от того, что написал сам автор книги «Oil-in-Water Nanosized Emulsions for Drug Delivery and Targeting»). Если вы не нашли необходимую информацию о книге — напишите в комментариях, мы постараемся отыскать её.
Oil-in-Water Nanosized Emulsions for Drug Delivery and Targeting — читать онлайн ознакомительный отрывок
Ниже представлен текст книги, разбитый по страницам. Система сохранения места последней прочитанной страницы, позволяет с удобством читать онлайн бесплатно книгу «Oil-in-Water Nanosized Emulsions for Drug Delivery and Targeting», без необходимости каждый раз заново искать на чём Вы остановились. Поставьте закладку, и сможете в любой момент перейти на страницу, на которой закончили чтение.
Интервал:
Закладка:
2.5.1.4. Formulation Optimization by QbD: Experimental Design
To identify the effect of (Taguchi design‐) screened CPPs (independent variables) such as castor oil concentration (1–2 ml, A), chitosan concentration (6–18 mg, B), and poloxamer concentration (75–100 mg, C) on the three CQAs (dependent or response variables) like MPS ( R 1), PDI ( R 2), and ZP ( R 3), a three‐factor face‐centered central composite design (CCD) was used. A total of 20 experiments, including 6 replications of central points (the leverage value of 0.1182 and α value of 1) together with 8 factorial points and 6 axial points (shown in Table 2.6), were run using Design‐Expert ®software. While the leverage value indicates the potential for a design point (axial, central, or factorial) for influencing the model fit, the α value determines the geometry of the design region and for face‐centered CCD, it is equal to 1 defining a square design geometry. Table 2.7summarizes the screened CPPs and their levels. The values of CQAs were fed into the software and second‐order mathematical model was used to study the factor–response (CPPs–CQAs) relationship. An appropriate polynomial model was chosen based on the significant terms ( p < 0.005, ANOVA), the least significant lack of fit, coefficient of variance, the multiple correlation coefficient, and adjusted multiple correlation coefficient provided by Design‐Expert ®software. The center point was repeated six times to determine the repeatability of the method.
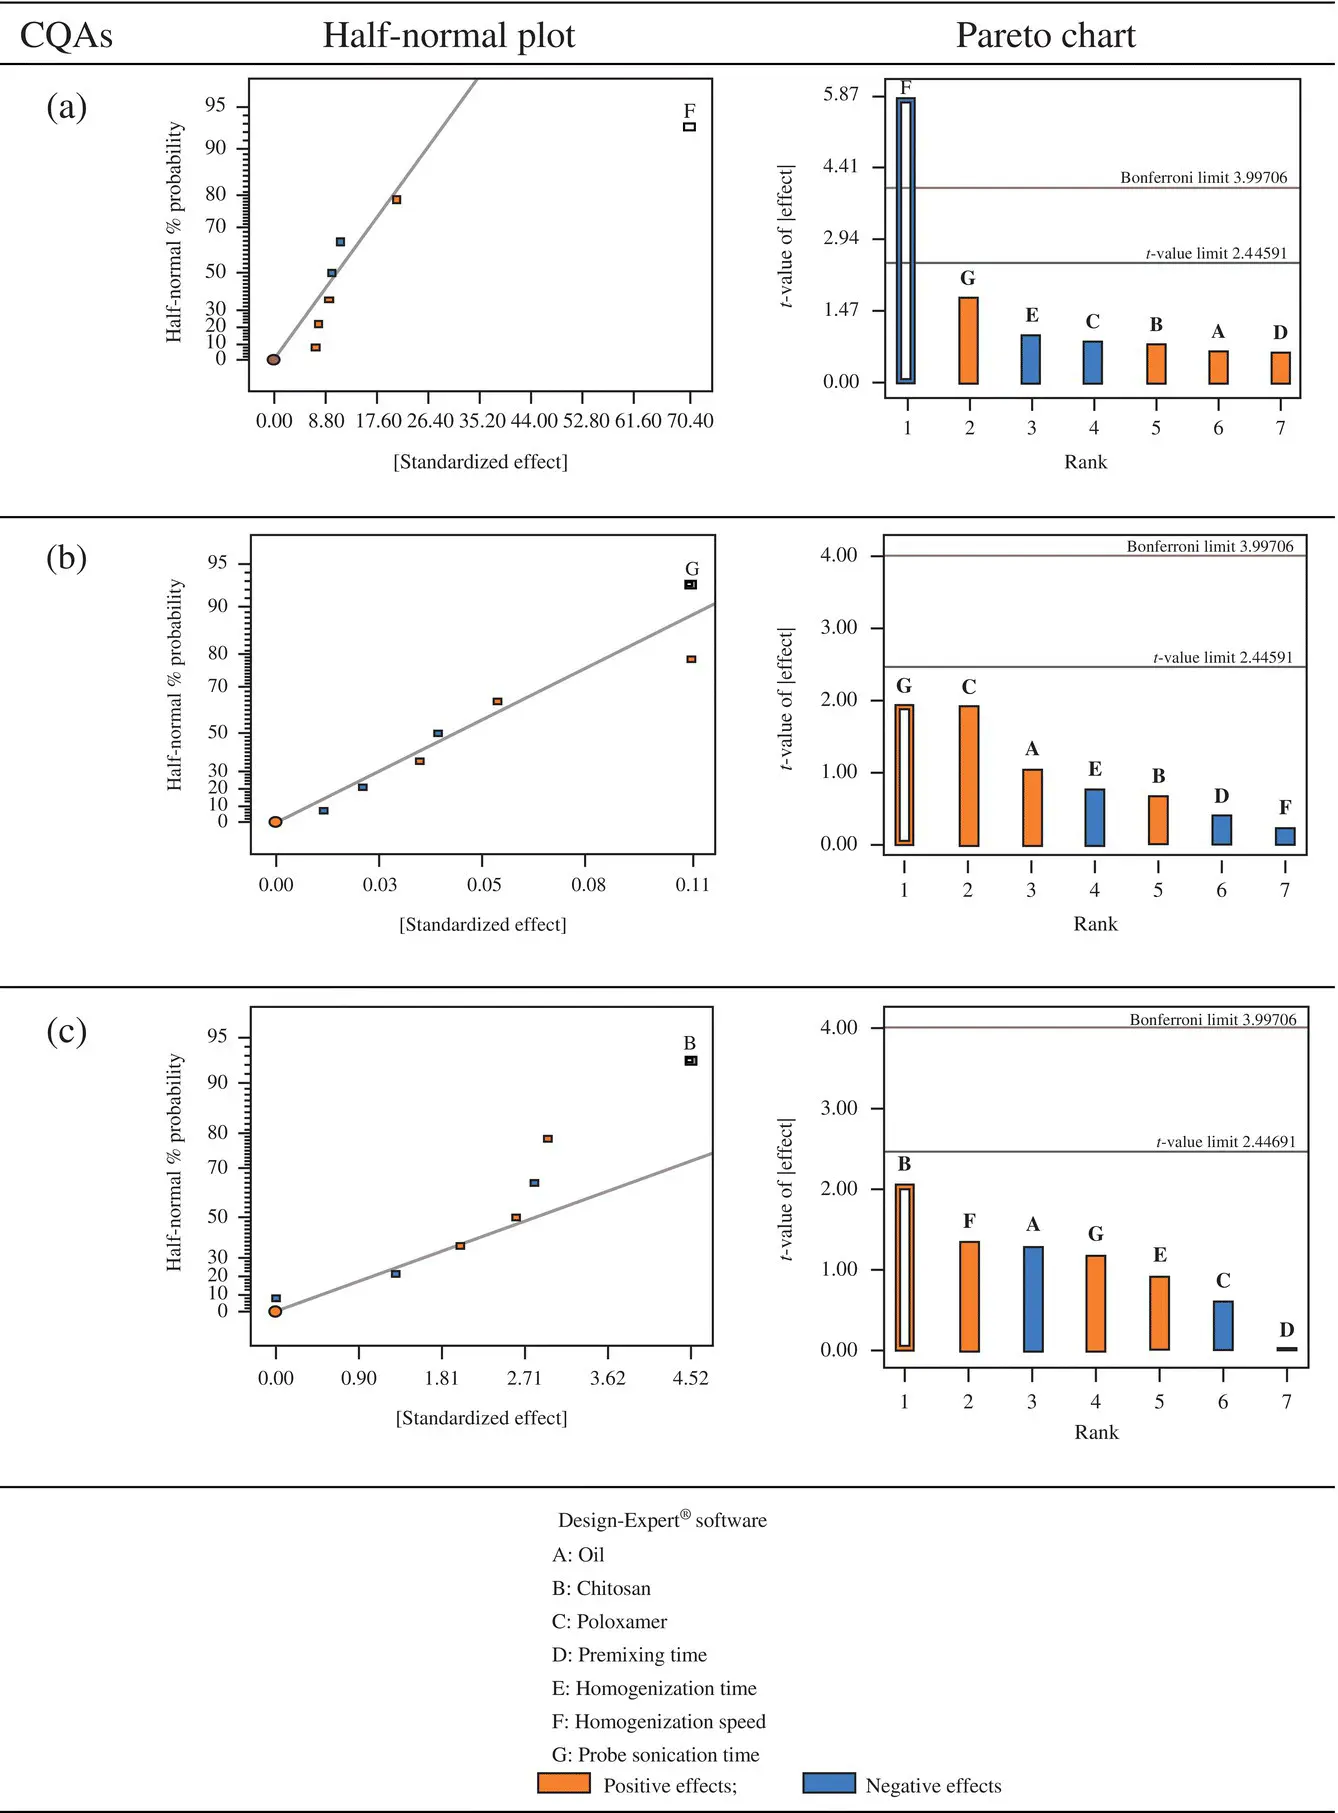
Figure 2.5. Half‐normal and Pareto charts for screening of influential formulation and process variables as per Taguchi design using selected critical quality attributes (CQAs): (a) mean particle size, (b) polydispersity index, and (c) zeta potential.
TABLE 2.6. Independent and Dependent (Response) Variables: Face‐Centered Central Composite Design (CCD) Scheme
| Run | Type | Critical Process Parameters (CPPs, also Called as Independent Variables) | Critical Quality Attributes (CQAs, also Called as Dependent Variables) | ||||
|---|---|---|---|---|---|---|---|
| Castor Oil (ml) | Chitosan (mg) | Poloxamer (mg) | MPS (nm) | PDI | ZP (mV) | ||
| 1 | Axial | 2 | 12 | 87.5 | 676.4 | 0.655 | 27.6 |
| 2 | Center | 1.5 | 12 | 87.5 | 609.8 | 0.655 | 27.2 |
| 3 | Factorial | 1 | 18 | 75 | 247.6 | 0.376 | 24.6 |
| 4 | Axial | 1.5 | 12 | 75 | 396.4 | 0.275 | 35.5 |
| 5 | Axial | 1.5 | 18 | 87.5 | 449.4 | 0.661 | 29.1 |
| 6 | Center | 1.5 | 12 | 87.5 | 609.8 | 0.655 | 27.2 |
| 7 | Factorial | 2 | 6 | 100 | 417.1 | 0.62 | 17.1 |
| 8 | Factorial | 2 | 18 | 100 | 438.1 | 0.469 | 23.2 |
| 9 | Factorial | 2 | 6 | 75 | 390.5 | 0.438 | 28.5 |
| 10 | Center | 1.5 | 12 | 87.5 | 609.8 | 0.655 | 27.2 |
| 11 | Axial | 1.5 | 12 | 100 | 441.5 | 0.488 | 18.8 |
| 12 | Axial | 1 | 12 | 87.5 | 374.2 | 0.435 | 33.6 |
| 13 | Axial | 1.5 | 6 | 87.5 | 333.9 | 0.408 | 30.6 |
| 14 | Center | 1.5 | 12 | 87.5 | 609.8 | 0.655 | 27.2 |
| 15 | Factorial | 1 | 6 | 75 | 240.1 | 0.287 | 17.9 |
| 16 | Factorial | 1 | 6 | 100 | 447.6 | 0.676 | 15.6 |
| 17 | Center | 1.5 | 12 | 87.5 | 609.8 | 0.655 | 27.2 |
| 18 | Factorial | 1 | 18 | 100 | 453.4 | 0.62 | 25.1 |
| 19 | Factorial | 2 | 18 | 75 | 492.8 | 0.537 | 20.9 |
| 20 | Center | 1.5 | 12 | 87.5 | 609.8 | 0.655 | 27.2 |
MPS, mean particle size; PDI, polydispersity index; ZP, zeta potential.
Each row indicates an experiment while the columns present the composition and the critical quality attributes (CQAs) of the non‐phospholipid‐based topical ophthalmic emulsions.
The search for design space and optimized emulsion formula was carried out by numerical and graphical techniques using the software. The interaction effect of the CPPs on the CQAs was visualized using the response surfaces and 3D contour plots of the fitted polynomial regression equation. Furthermore, the quantitative comparison between the theoretical prediction and obtained experimental values was used by plotting the predicted versus observed value curve to validate/verify the chosen face‐centered CCD model. The predicted error is the difference between the experimental value and the predicted value divided by predicted value.
TABLE 2.7. Low and High Levels of Critical Material Attributes (CMAs) and Critical Process Parameters (CPPs, also Called as Independent Variables) Along with the Goals of Critical Quality Attributes (CQAs, also Called as Dependent Variables) Used for Making Face‐Centered Central Composite Design (CCD) Throughout the Initial Pilot Screening Study to Prepare Topical Ophthalmic Emulsions
| Screened CMAs and CPPs | Quantity | Levels | |
|---|---|---|---|
| Low | High | ||
| X 1: Castor oil (ml) | 1, 1.5, 2 | 1 | 2 |
| X 2: Chitosan (mg) | 6, 12, 18 | 6 | 18 |
| X 3: Poloxamer (mg) | 75, 87.5, 100 | 75 | 100 |
| CsA (% w/w) | 0.05 or 0.1 | ||
| Glycerin (g) | 2.25 | ||
| Double distilled water (ml) | Upto 100 | ||
| Selected CQAs | Goal | ||
| R 1: Mean particle size | Minimize | ||
| R 2: Polydispersity index | Minimize | ||
| R 3: Zeta potential | Maximize |
Note: Italics numbers and texts indicate constant quantity of independent variables while the quantity of other independent variables were altered.
2.5.1.5. Systematic Optimization Using Face‐Centered CCD
A Box–Wilson central composite design, commonly termed as CCD, is frequently utilized to build a second‐order polynomial for the response variables (CQAs) in RSM without using a complete full factorial design of experiments. There are two main varieties of CCD, namely, face‐centered CCD and rotatable CCD. Due to its simplicity, regions of interest, and operability, the face‐centered CCD was chosen in the present study. As per the face‐centered CCD, the optimal composition and the experimental conditions to prepare the topical ophthalmic emulsions were fixed ( Table 2.7). Although the goal of ZP is fixed at maximum ( Table 2.7) by considering the previous observation that a stable cationic nanosized emulsion should contain the ZP value that ranges from +25 to +45 mV (Tamilvanan et al. 2010), the stable stability of emulsion is not increasing with the increase of ZP's values. With the help of polynomial regression equation, the factor–response relationship was examined for the response function (Yi) using the generalized response surface model [as given in Eq. (2.2)]. In Eq. ( 2.2), the terms X 1, X 2, and X 3indicate the three different factors (CPPs, independent variables) such as amounts of castor oil, chitosan, and poloxamer, respectively. While the term a 0represents intercept ( a constant), the linear (first‐order), quadratic (second‐order), and interactive polynomial coefficients are given as a 1, a 2, and a 3(in general, a i), a 11, a 22, and a 33(in general, a ii), and a 12, a 13, and a 23(in general, a ij), respectively.
Читать дальшеИнтервал:
Закладка:
Похожие книги на «Oil-in-Water Nanosized Emulsions for Drug Delivery and Targeting»
Представляем Вашему вниманию похожие книги на «Oil-in-Water Nanosized Emulsions for Drug Delivery and Targeting» списком для выбора. Мы отобрали схожую по названию и смыслу литературу в надежде предоставить читателям больше вариантов отыскать новые, интересные, ещё непрочитанные произведения.


Обсуждение, отзывы о книге «Oil-in-Water Nanosized Emulsions for Drug Delivery and Targeting» и просто собственные мнения читателей. Оставьте ваши комментарии, напишите, что Вы думаете о произведении, его смысле или главных героях. Укажите что конкретно понравилось, а что нет, и почему Вы так считаете.