Tamilvanan Shunmugaperumal - Oil-in-Water Nanosized Emulsions for Drug Delivery and Targeting
Здесь есть возможность читать онлайн «Tamilvanan Shunmugaperumal - Oil-in-Water Nanosized Emulsions for Drug Delivery and Targeting» — ознакомительный отрывок электронной книги совершенно бесплатно, а после прочтения отрывка купить полную версию. В некоторых случаях можно слушать аудио, скачать через торрент в формате fb2 и присутствует краткое содержание. Жанр: unrecognised, на английском языке. Описание произведения, (предисловие) а так же отзывы посетителей доступны на портале библиотеки ЛибКат.
- Название:Oil-in-Water Nanosized Emulsions for Drug Delivery and Targeting
- Автор:
- Жанр:
- Год:неизвестен
- ISBN:нет данных
- Рейтинг книги:5 / 5. Голосов: 1
-
Избранное:Добавить в избранное
- Отзывы:
-
Ваша оценка:
Oil-in-Water Nanosized Emulsions for Drug Delivery and Targeting: краткое содержание, описание и аннотация
Предлагаем к чтению аннотацию, описание, краткое содержание или предисловие (зависит от того, что написал сам автор книги «Oil-in-Water Nanosized Emulsions for Drug Delivery and Targeting»). Если вы не нашли необходимую информацию о книге — напишите в комментариях, мы постараемся отыскать её.
Oil-in-Water Nanosized Emulsions for Drug Delivery and Targeting — читать онлайн ознакомительный отрывок
Ниже представлен текст книги, разбитый по страницам. Система сохранения места последней прочитанной страницы, позволяет с удобством читать онлайн бесплатно книгу «Oil-in-Water Nanosized Emulsions for Drug Delivery and Targeting», без необходимости каждый раз заново искать на чём Вы остановились. Поставьте закладку, и сможете в любой момент перейти на страницу, на которой закончили чтение.
Интервал:
Закладка:
The coefficient significance of the quadratic polynomial models was evaluated by using Analysis of Variance (ANOVA). For any of the terms in the models, a large F ‐value and a small p ‐value indicated more significant effect on the respective response variables (Joglekar 1987). Table 2.8shows the effect of independent variables on the variation of the physicochemical properties of topical ophthalmic emulsions. The variable that exhibited the largest and significant ( p < 0.05) effect on the MPS of the emulsion for the linear term was castor oil amount. The other two variables (amounts of chitosan and poloxamer) showed insignificant effects. All the interaction terms showed insignificant effect on MPS. The quadratic terms of chitosan amount exhibited significant effect on MPS while other two terms showed insignificant effect.
The independent variables that most affect the ZP value of the emulsions for the linear term were poloxamer amount followed by the linear term of chitosan amount and castor oil amount but none of the linear terms has any significant effect. All the three interaction and quadratic effects have insignificant effect ( p > 0.05) on the ZP value of the emulsions.
For the PDI, the linear and quadratic terms of poloxamer amount have the significant effect while all other linear, interaction, and quadratic terms have insignificant effect. Thus, it was indicated that in evaluating the response variation of PDI, it was important to consider the poloxamer amount.
2.5.1.6. Response Surface Plot Analysis
The 3D response surface graphs for the selected CQAs ( R 1:MPS, R 2:PDI, and R 3:ZP) of topical ophthalmic emulsions are shown in Fig. 2.6. To represent the 3D graphs for R 1(MPS), there are three different plots designated as Fig. 2.6a–c. In a similar way, the 3D graphs for R 2(PDI) and R 3(ZP) are also represented, respectively, as Fig. 2.6d–f and Fig. 2.6g–i. From Fig. 2.6a and b, the MPS value increases with an increase in the amount of castor oil. Two possible explanations might be provided with this observation. The oil droplet disruption process during homogenization and probe sonication of coarse emulsion gets somewhat cumbersome due to the progressive increment of castor oil amount because of the resistance in oil flow and thus the diminution/restriction in the oil droplet breakup rate. The MPS value increase due to the increase of castor oil amount might also be attributed to the increased rates of oil droplets—droplets collision frequency especially at lower castor oil amount, which ultimately leads to the higher probability of coalescence of the smaller droplets and thus the bigger droplet formation at the expense of smaller droplets.
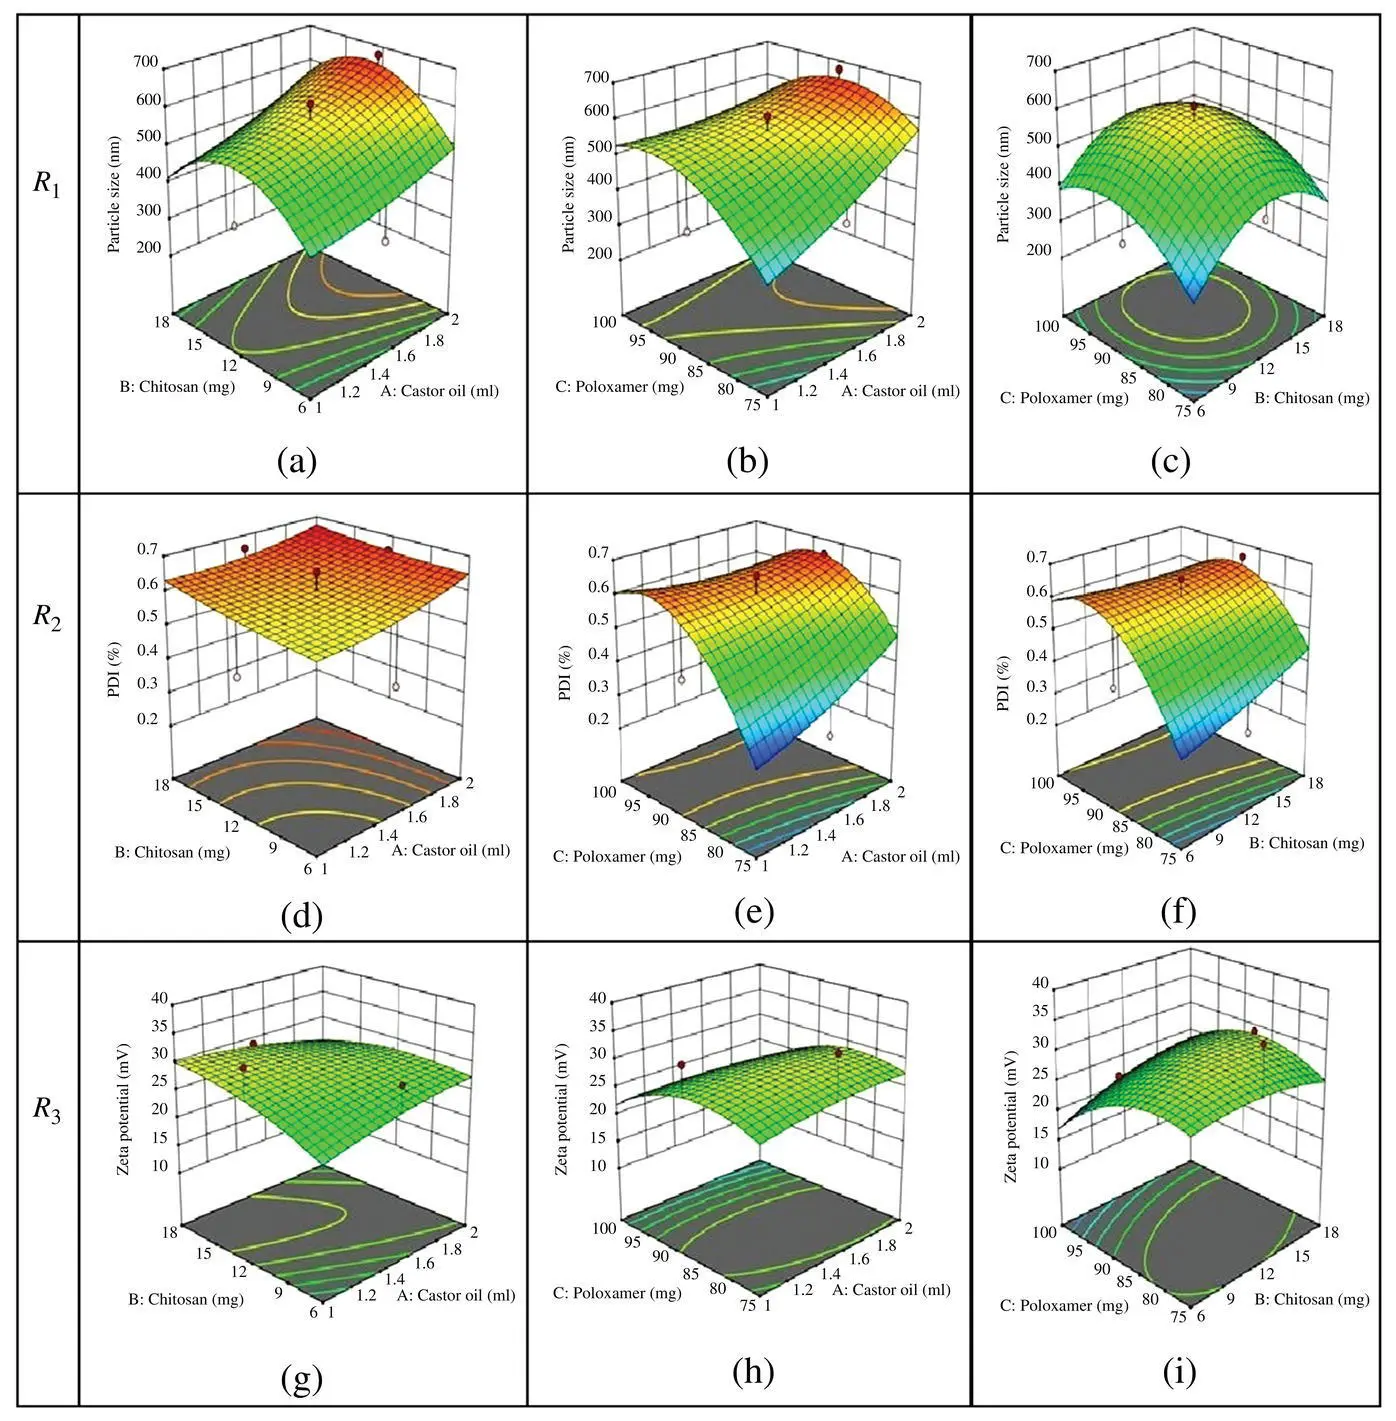
Figure 2.6. Response surface plots showing the interaction effects of castor oil and chitosan (a, d, g), castor oil and poloxamer (b, e, h), and chitosan and poloxamer (c, f, i) on response, mean particle size ( R 1), polydispersity index ( R 2), and zeta potential ( R 3), respectively.
The presence of two different emulsifying agents (chitosan and poloxamer) either alone or in combination influenced the MPS in a biphasic manner. An initial increment until to reach a sharp break‐point followed by a progressive decrement in the MPS value was noticed when these two emulsifying agents interacted ( Fig. 2.6c) as well as even in the occurrence of interaction between chitosan and castor oil ( Fig. 2.6a) or poloxamer and castor oil ( Fig. 2.6b). The initial particle size increment might be due to an inadequate amount of emulsifying agent(s) to form a mono‐ or multilayer film onto the dispersed oil droplets of the emulsion during emulsification (Jumaa and Müller 1998). Due to the attainment of the critical interfacial tension reduction at the vicinity of oil and water by the sufficient amount of emulsifying agent(s) resulted in the diminution of Laplace pressure, p , and thus the stress required for droplet deformation is reduced (Tang et al. 2012).
The PDI value is ranged from 0 to 1 wherein PDI < 0.1 indicates a nearly homogenous monodisperse formulation. The PDI value between 0.1 and 0.2 specifies a particle population with relatively narrow size distribution while the PDI > 0.3 designates polydispersity with variations in particle size without a distinct distribution shape (Müllar 1990; Cegnar et al. 2004). The experimental CPPs involved in the preparation of topical ophthalmic emulsions may influence the performance of CQAs (PDI). All of the studied CPPs (amounts of castor oil, chitosan, and poloxamer) produced a direct relationship with PDI values observed. An increase in CPPs amounts increases the PDI values ( Fig. 2.6d–f). Higher is the amount of castor oil, lesser is the oil breakdown frequency during emulsification promoting the formation of larger sized oil droplets and thus the PDI to attain a higher value. Increasing the amounts of these two emulsifying agents (chitosan and poloxamer) either alone ( Fig. 2.6d and e) or in combination ( Fig. 2.6f) also increased the PDI values. For instance, the PDI value of >0.6 was noted when the interaction between chitosan and castor oil occurred ( Fig. 2.6d). But the interaction between poloxamer and castor oil yielded the PDI value of ~0.6 ( Fig. 2.6e). However, the combined interaction of two emulsifying agents produced the PDI value of <0.6 ( Fig. 2.6f). These effects are possibly due to the progressive increase in the apparent viscosity of the emulsion, which ultimately provides a higher flow resistance in the batch emulsification process (Müllar 1990). In consequence, this condition increased the coalescence rate resulting in a large particle size to form. Moreover, the large particles with inadequate emulsifier film coverage tend to coalesce faster than small particles. This phenomenon contributed to the high PDI value. Figure 2.6g–i demonstrates that by increasing the chitosan or castor oil concentration, the ZP value increases. In contrast, a biphasic manner, i.e., an initial increase followed by decrease in the ZP values, was observed with an increase in poloxamer concentration ( Fig. 2.6h and i). It should be added that the present topical ophthalmic emulsions were stabilized by both electrostatic and steric mechanisms due to the chitosan and poloxamer emulsifier combination. Whatever the strong repulsive Coulomb force occurred between the protonated chitosan molecules must be counterbalanced by the week van der Waals attraction forces or the steric hindrance effect of poloxamer. That is why the biphasic attitude was seen for the influence of poloxamer concentration on ZP values (Tamilvanan 2009).
2.5.1.7. Optimization of Responses for Formulation of CsA‐Loaded Nanosized Emulsion
By using graphical optimization, an overlay plot ( Fig. 2.7g) showing the obtained design space (highlighted) was produced by the Design‐Expert ®software. From the overlay plot, the design space representing desired amounts of CPPs and the selected CQAs ( R 1:MPS, R 2:PDI, and R 3:ZP) values of topical ophthalmic emulsions was found out. Within the design space, the optimized formula was selected that consists of minimum MPS and PDI values but maximum ZP value. The CPPs amounts found in the optimized formula are 1.39 ml castor oil, 6 mg chitosan, and 75 mg poloxamer. Similarly, the CQAs values established for the optimized formula within the design space are 260.173 nm, 0.275 and 25.85 mV, respectively, for MPS, PDI, and ZP.
To substantiate further the established optimized formula for topical ophthalmic emulsion within the design space, the predictability of chosen face‐centered CCD model is at first corroborated by evaluating the randomly selected six different formulae along with the optimized formula for the actual CQAs values and comparing them with the predicted CQAs values. The diagnostic plot of actual versus predicted CQAs ( R 1:MPS, R 2:PDI, and R 3:ZP) values are shown in Fig. 2.7a–f. Interestingly, the actual versus predicted plots for all of the CQAs were shown the r 2value of greater than 0.9 indicating the establishment of the closeness between the values and hence conformed/justified the predictability of chosen model within the design space ( Fig. 2.7b, d, and f). The value of randomness of scatter and deviations was found to be within ±4% in residual versus predicted value plot ( Fig. 2.7a, c, and e). Furthermore, the chosen model also showed an overall mean percent error value of 0.30 ± 0.13%. In addition, an adequate precision should measure the signal‐to‐noise ratio, and its value of greater than 4 is desirable. As per the selected face‐centered CCD model, the signal‐to‐noise ratio values shown by Design‐Expert ®software for MPS, PDI, and ZP were 8.701, 6.415, and 4.6524, respectively. This directly indicates that the adequate precision is produced and therefore this model can be used to navigate the design space to find out the optimized formula for topical ophthalmic emulsion.
Читать дальшеИнтервал:
Закладка:
Похожие книги на «Oil-in-Water Nanosized Emulsions for Drug Delivery and Targeting»
Представляем Вашему вниманию похожие книги на «Oil-in-Water Nanosized Emulsions for Drug Delivery and Targeting» списком для выбора. Мы отобрали схожую по названию и смыслу литературу в надежде предоставить читателям больше вариантов отыскать новые, интересные, ещё непрочитанные произведения.


Обсуждение, отзывы о книге «Oil-in-Water Nanosized Emulsions for Drug Delivery and Targeting» и просто собственные мнения читателей. Оставьте ваши комментарии, напишите, что Вы думаете о произведении, его смысле или главных героях. Укажите что конкретно понравилось, а что нет, и почему Вы так считаете.