Siegfried Siegesmund - Monument Future
Здесь есть возможность читать онлайн «Siegfried Siegesmund - Monument Future» — ознакомительный отрывок электронной книги совершенно бесплатно, а после прочтения отрывка купить полную версию. В некоторых случаях можно слушать аудио, скачать через торрент в формате fb2 и присутствует краткое содержание. Жанр: unrecognised, на немецком языке. Описание произведения, (предисловие) а так же отзывы посетителей доступны на портале библиотеки ЛибКат.
- Название:Monument Future
- Автор:
- Жанр:
- Год:неизвестен
- ISBN:нет данных
- Рейтинг книги:4 / 5. Голосов: 1
-
Избранное:Добавить в избранное
- Отзывы:
-
Ваша оценка:
Monument Future: краткое содержание, описание и аннотация
Предлагаем к чтению аннотацию, описание, краткое содержание или предисловие (зависит от того, что написал сам автор книги «Monument Future»). Если вы не нашли необходимую информацию о книге — напишите в комментариях, мы постараемся отыскать её.
Alle vier Jahre treffen sich auf einer internationalen Tagung Experten, die sich mit den entsprechenden Sachfragen beschäftigen. Der „14th International Congress on the Deterioration and Conservation of Stone“ findet im September 2020 in Göttingen statt. Er ist die wichtigste Veranstaltung zur Verbreitung des Wissens von Praktikern und Forschern, die im Bereich der Steinkonservierung zur Erhaltung des baulichen Kulturerbes arbeiten: Geowissenschaftler, Architekten, Bauspezialisten, Ingenieure, Restauratoren, Denkmalpfleger und Bauherren.
Der Tagungsband mit über 150 wissenschaftlichen Beiträgen repräsentiert und erfasst den neuesten Stand der Technik auf diesem Gebiet.
Themen sind:
– Charakterisierung von Schadensphänomenen von Steinen und verwandten Baumaterialien (Stuck, Putz, Mörtel usw.)
– Methoden zur Untersuchung des Steinverfalls in situ und zerstörungsfreie Prüfung
– Langzeitüberwachung von Steindenkmälern und Gebäuden
– Simulation und Modellierung des Zerfalls
– Technologien und Entwicklung verbesserter Bearbeitung und Verwendung von Stein in Neubauten
– Bewertung der Langzeitwirkung von Bearbeitungstechniken
– Auswirkungen des Klimawandels auf die Steinverwitterung des Kulturerbes
– Berichte zur Steinkonservierung: Fallstudien und Projekte
– Digitalisierung und Dokumentation von Steinkonservierung
–
The 14th International Congress on the Deterioration and Conservation of Stone, entitled MONUMENT FUTURE: DECAY AND CONSERVATION OF STONE is a quadrennial event that brings together a world-wide community of geoscientists, architects, building specialists, engineers, conservators, restorators, monument curators and building owners who are concerned about the conservation of cultural stone structures and objects. Since antiquity, the weathering and deterioration of historical buildings, masonry, monuments, sculptures etc. using natural stones has been a very well-known problem.
This conference is the main gathering for the dissemination of knowledge in the field of stone deterioration issues. It represents and captures the state-of-the-art in the field of stone conservation and cultural heritage conservation with regards to the following topics:
– Characterisation of damage phenomena of stone and related building materials (plaster, rendering, mortar etc.)
– Methods for the investigation of stone decay; in-situ and non-destructive testing
– Long-term monitoring of stone monuments and buildings
– Simulation and modelling of decay
– Technology and development of improved treatments and use of stone in new buildings
– Assessment of long-term effects of treatments
– Impact of climate change on stone decay of Cultural Heritage
– Reports about stone conservation: case studies and projects
– Digitalization and documentation in stone conservation
Monument Future — читать онлайн ознакомительный отрывок
Ниже представлен текст книги, разбитый по страницам. Система сохранения места последней прочитанной страницы, позволяет с удобством читать онлайн бесплатно книгу «Monument Future», без необходимости каждый раз заново искать на чём Вы остановились. Поставьте закладку, и сможете в любой момент перейти на страницу, на которой закончили чтение.
Интервал:
Закладка:
In this paper, we record P- and S-waveforms in three sandstones used in the Scottish heritage and obtain the P- and S-velocities as well as the calculation of wavelength of the P-waves in both fresh and salt weathered samples. We use an automatic methodology for the calculation of onset time that includes the signal pre-processing and the analysis, in the time-domain, of the first pulse symmetry, amplitude and duration criteria. This triple check provides greater confidence in the obtained results. This method limits human error, while improving the accuracy and reproducibility of P and S wave onset time estimations.
Materials and Methods
Stones
In this paper three sandstones used in the Scottish heritage are investigated:
Doddington sandstone (D) is a common building stone used throughout Scotland and is currently used as a replacement stone at Jedburgh Abbey, Scotland. The sandstone is quarried at Doddington quarry near Wooler in the Scottish Borders region; and forms part of the Fell formation, deposited during the early-mid Carboniferous. The sandstone is mineralogically mature and textural immature; with rounded-sub rounded grain shape and an average grain size of 0.25 mm. Mineralogy consists of: quartz (90 %); feldspar (mainly orthoclase) (10 %); and minor amounts of muscovite, lithic fragments and clay within the matrix. The sandstone is classified as a quartz-arenite.
St. Bees sandstone (BC) is currently used as a replacement stone at Arbroath Abbey and is quarried on the west coast of Cumbria, England. The red-dark red sandstone is part of the Chester sandstone formation, deposited during the early Triassic. The sandstone is texturally and mineralogically immature; with (sub)rounded – (sub)angular grain shape and an average grain size of 0.12 mm. The sandstone is classified as a lithic arkose. Mineralogy consists of: quartz (60 %); feldspar (orthoclase and plagioclase) (20 %); lithic fragments (10 %); mica (biotite and muscovite) (10 %); and clay-rich matrix. BC exhibits planar 193bedding on a scale of 1–2 mm. Therefore, during this study BC samples were measured in two directions: parallel and perpendicular to bedding, to determine the degree of anisotropy and potential effects on output signals.
Forest of Dean (F) is a distinctive grey-green sandstone used throughout the UK, for example in the restoration of Dunkeld Cathedral, Scotland. The sandstone forms part of the Pennant sandstone formation deposited during the mid-late Carboniferous; and is currently quarried at Barnhill quarry in the county of Gloucestershire, England. The sandstone is mineralogically and texturally immature; with (sub) angular grain shape and an average grain size of 0.19 mm. Mineralogy consists of: quartz (70 %); feldspar (orthoclase and plagioclase) (10 %); lithic fragments (15 %); muscovite (5 %); and a clay-rich matrix. The sandstone is classified as a (sub)litharenite.
Ultrasounds
The ultrasonic measurements were carried out by means of the transmission method, which consists of two piezoelectric sensors coupled to the sample at constant pressure. Compressive (P) and shear (S) waves were measured using polarised Panametric transducers (1 MHz). Emitting-receiving equipment (Panametrics-NDT 5058PR) and an oscilloscope (TDS 3012B-Tektronix) were used to acquire and digitalize the waveforms to be displayed, manipulated and stored. Two types of visco-elastic couplants were used to achieve good coupling between the transducer and the sample: one of a fluid consistency for the P-wave transducers (eco-gel), and another of a more viscous consistency for the S-waves (SWC, shear wave couplant, GE Panametrics).
In this work, we have applied a new method for automatic characterisation of the first pulse in both compressional and shear waves described in Benavente et al., (2020). Firstly, the recorded signal is pre-processed in the wavelet domain. This step filters noise and removes low-frequency disruption. Secondly, the recorded signal is analysed in the time-domain. This step identifies and characterises the first pulse, allowing for an estimation of onset time. Using the automatic approach allows for all detected pulses in the output signal to be analysed, where the first pulse of the P or S wave is determined based on criteria related to symmetry, amplitude and duration. The method outlined above is carried out using Matlab based on Galiana-Merino et al. (2013), where parts of the pre-processing stage are carried out using the Wavelet Toolbox. This triple check provides greater confidence in the results. We obtain the automatic onset time from recorded P- and S- waveforms and they are compared to manual picking, which is considered as a true or reference value.
Finally, the wavelength, λ, was calculated using the velocity, v, and frequency, f, of the first pulse as λ=v/f.
Salt crystallisation test
Salt crystallisation tests were in concordance with EN-12370 (1999) recommendations, respectively. 4 cm cubic samples of each lithotype were tested and underwent cycles of saline immersion (14 % w/w Na 2SO 4solution, at 20 °C for 4 hours), drying (at 60 °C for 16 hours) and cooling at room conditions (20 °C, for 4 hours). Samples were exclusively cleaned at the end of the test (after the 15 cycles). P and S waves were measured before and after the durability test. Every measurement of the P and S waves was repeated three times in order to test the reproducibility of the experiments and the corresponding results. Figures 1 and 2 display, respectively, P and S signals for fresh and weathered samples. They aim to show the evolution of waveform rather than wave velocities because the sample length may vary from samples to sample. Tested samples have a cubic shape and the edge length range from 40–50 mm. Moreover, weathered samples may also suffer superficial weight loss, resulting in a decrease in edge length.
Results and Discussion
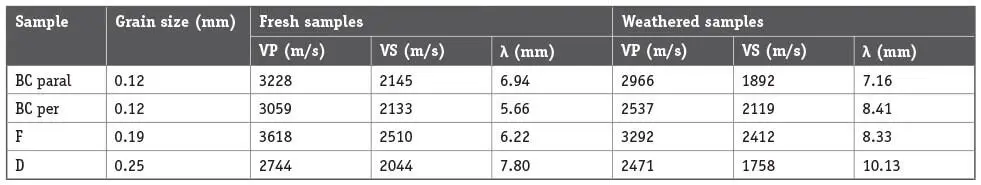
For the studied sandstones, the arrival time of P-wave signals are easily identifiable with a high SNR, although their waveforms and wavelength values are dependent on the type of rock being 194analysed. The frequency of the samples decreases with particle size (Fig. 1). Inversely, coarse-grained rocks have the highest wavelength values for the studied rocks ( Table 1) and also the degree of salt crystallization. The wavelength of output signals depends on grain size, while microstructural components of the rocks such as pores, fractures, grains and the presence of salts operate as a wavelength filter. The frequency associated with the first pulse of the output signal differs from the central frequency of the input elastic waves which is fixed at 1 MHz. This is the result of the interaction between elastic wave and microstructural rock components. Manual picking of the onset time for elastic waves becomes more difficult with increase in wavelength, although this observation is less important for P-waves than S-waves (Figs. 1 and 2).
Table 1: Automatic mean values of grain size, P- (VP) and S-wave (VS) and wavelength (λ) for fresh and weathered sandstones.
The recorded signals highlight that the microstructural components of rocks and their modification by salt crystallization affect the output signal. Values for manual and calculated P-wave are almost equal (Fig. 3). Without concluding which results are closer to reality, one may compare the results of a proposed method with the results obtained by a human analyst (Sarout et al., 2009). If we assume that manual measuring offers a true or reference value (e. g.: Siegesmund and Dürrast, 2011), then it can be concluded that the proposed method accurately calculates P-waves velocities for a range of studied rocks.
Читать дальшеИнтервал:
Закладка:
Похожие книги на «Monument Future»
Представляем Вашему вниманию похожие книги на «Monument Future» списком для выбора. Мы отобрали схожую по названию и смыслу литературу в надежде предоставить читателям больше вариантов отыскать новые, интересные, ещё непрочитанные произведения.


Обсуждение, отзывы о книге «Monument Future» и просто собственные мнения читателей. Оставьте ваши комментарии, напишите, что Вы думаете о произведении, его смысле или главных героях. Укажите что конкретно понравилось, а что нет, и почему Вы так считаете.