Michael Begon - Ecology
Здесь есть возможность читать онлайн «Michael Begon - Ecology» — ознакомительный отрывок электронной книги совершенно бесплатно, а после прочтения отрывка купить полную версию. В некоторых случаях можно слушать аудио, скачать через торрент в формате fb2 и присутствует краткое содержание. Жанр: unrecognised, на английском языке. Описание произведения, (предисловие) а так же отзывы посетителей доступны на портале библиотеки ЛибКат.
- Название:Ecology
- Автор:
- Жанр:
- Год:неизвестен
- ISBN:нет данных
- Рейтинг книги:5 / 5. Голосов: 1
-
Избранное:Добавить в избранное
- Отзывы:
-
Ваша оценка:
Ecology: краткое содержание, описание и аннотация
Предлагаем к чтению аннотацию, описание, краткое содержание или предисловие (зависит от того, что написал сам автор книги «Ecology»). Если вы не нашли необходимую информацию о книге — напишите в комментариях, мы постараемся отыскать её.
– now in full colour – offers students and practitioners a review of the ecological sciences.
The previous editions of this book earned the authors the prestigious ‘Exceptional Life-time Achievement Award’ of the British Ecological Society – the aim for the fifth edition is not only to maintain standards but indeed to enhance its coverage of Ecology.
In the first edition, 34 years ago, it seemed acceptable for ecologists to hold a comfortable, objective, not to say aloof position, from which the ecological communities around us were simply material for which we sought a scientific understanding. Now, we must accept the immediacy of the many environmental problems that threaten us and the responsibility of ecologists to play their full part in addressing these problems. This fifth edition addresses this challenge, with several chapters devoted entirely to applied topics, and examples of how ecological principles have been applied to problems facing us highlighted throughout the remaining nineteen chapters.
Nonetheless, the authors remain wedded to the belief that environmental action can only ever be as sound as the ecological principles on which it is based. Hence, while trying harder than ever to help improve preparedness for addressing the environmental problems of the years ahead, the book remains, in its essence, an exposition of the
of ecology. This new edition incorporates the results from more than a thousand recent studies into a fully up-to-date text.
Written for students of ecology, researchers and practitioners, the fifth edition of
is anessential reference to all aspects of ecology and addresses environmental problems of the future.
Ecology — читать онлайн ознакомительный отрывок
Ниже представлен текст книги, разбитый по страницам. Система сохранения места последней прочитанной страницы, позволяет с удобством читать онлайн бесплатно книгу «Ecology», без необходимости каждый раз заново искать на чём Вы остановились. Поставьте закладку, и сможете в любой момент перейти на страницу, на которой закончили чтение.
Интервал:
Закладка:
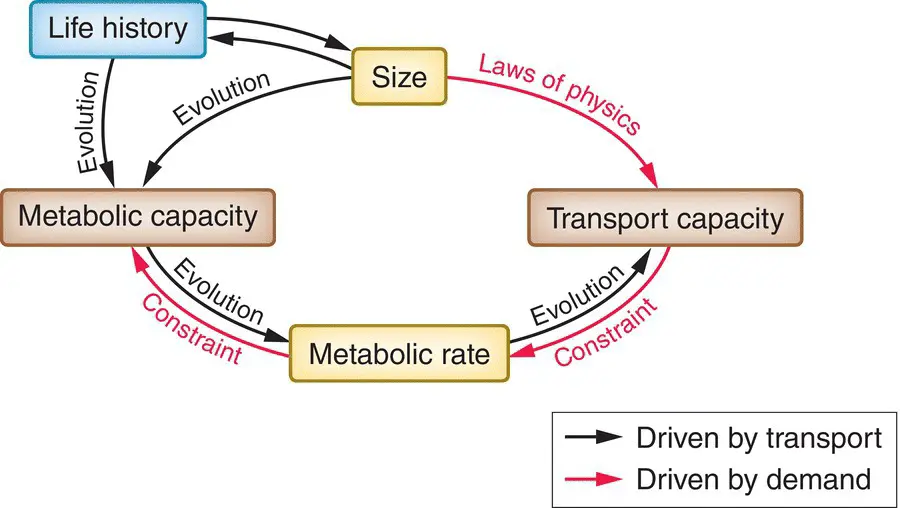
Figure 3.32 Schematic representation of the two main approaches to the relationship between metabolic rate and size.In one, indicated by the red arrows, size sets limits to rates of supply of nutrients (and of transport generally, for example of waste product excretion) and these supply routes or transport networks constrain an organism’s metabolic rate. In the other approach, indicated by black arrows, an organism’s life history, of which size is an integral part, evolves to match its environment, and the metabolic rate evolves to satisfy the demands (the metabolic capacity) of an organism with such a life history. The transport network, in turn, evolves to satisfy the demands of the metabolic rate.
temperature dependence
For a more complete account of metabolic theory, we must add the effects of temperature on metabolism to the effects of size. We saw in Section 2.3that over a biologically realistic range of temperatures, the rate, Y , of a metabolic process is expected to increase exponentially, and this is conventionally described by the Arrhenius equation:
(3.3) 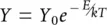
in which Y 0is the normalisation constant, as above, E is the activation energy required for that process, k is the so‐called Boltzmann’s constant and T is the temperature in Kelvin (a scale starting at absolute zero, in which 0°C is 273 Kelvin, and increments are the same as in the centigrade scale). For our purposes, we need only note that as temperature increases,  decreases,
  increases, and hence the metabolic rate increases exponentially.
Clearly, we can bring metabolism, size and temperature together and obtain
(3.4) 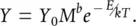
In practice, however, most studies focus on size and allow for temperature by dealing not with simple metabolic rates but temperature‐compensated metabolic rates (see, for example, Figure 3.31). Here, too, therefore, we return to Equation 3.2and the value of b .
a basis for metabolic scaling: SA and RTN theories
What should the allometric exponent be? As explained before, most answers to this question have focused on constraints on rates of transport. There have been two main types of theory: surface area theories (SA) and resource‐transport network theories (RTN), both with histories stretching back to the 1800s (Glazier (2014); and see Glazier (2005) for a much fuller subdivision of theories). SA theories argue that the rate of any metabolic process is limited by the rate at which resources for that process can be transported in, or at which the heat or waste products generated by the process can be transported out. This transport occurs across a surface, either within the organism or between the organism and its environment, the extent of which increases with the square (power 2) of linear size – as too, therefore, does the metabolic rate. However, assuming no change in shape, mass itself increases with the cube (power 3) of linear size. Hence, the metabolic rate, rather than keeping up with this increase in mass (where b would be 1) lags behind, scaling with mass with an exponent ( b ) of  or 0.67.
RTN theories, on the other hand, focus on the geometries of transport networks that would optimise the flow of nutrients being dispersed from a centralised hub to target tissues within an organism, or the flow of waste products carried away in an equivalent manner in the opposite direction. Derivations based on networks assumed to be of this type are more complex than the simple area‐to‐volume arguments applied above. However, we can ignore these details and note simply that initial attempts to derive a metabolic scaling rule based on such networks led to a b value of  or 0.75 (West et al ., 1997), while subsequent elaborations confirmed this value if the velocity of flow itself scales with mass, but suggested a value closer to 0.67 if velocity does not vary significantly with mass (Banavar et al ., 2010). A value of 0.75 is attractive in that it conforms with an empirical estimate derived long ago by Kleiber (1932) from an analysis of metabolic rates in a number of birds and mammals. This had given rise to the so‐called ‘Kleiber’s law’, but the law had lacked a convincing theoretical underpinning before West et al .’s study.
a universal b ?
Attempts like these to derive an ‘expected’ value for b have often been motivated by a wish to discover fundamental organising principles governing the world around us –universal rules linking metabolism to size – a single, common value of b (Brown et al ., 2004). Others have suggested that such generalisations may be oversimplified (Glazier, 2010, 2014). There need be no conflict between these two viewpoints. It can be valuable to have a single, simple theory that goes a long way towards explaining the patterns we see in nature. But it is also valuable to have a more complex, multifaceted theory that explains even more, including apparent exceptions to the simple rule. Similarly, when we examine data for these relationships, it can be valuable to focus on the general trend and fit a single line to the data, even if there is considerable variation around that general trend. But it is also valuable to treat that variation not as noise but as something requiring an explanation in its own right – for which a more complex model may be required.
A review of the data, overall, argues against a universal value for b . The analysis in Figure 3.31suggested that a single value between 0.67 and 0.75 was appropriate for multicellular animals (metazoa), unicellular organisms and plants. However, a more detailed look suggests that metazoa do indeed have an exponent of around 0.75, but for unicellular eukaryotes (protists) the value is close to 1 (isometry) and for prokaryotes significantly greater than 1 ( Figure 3.33) (DeLong et al ., 2010). DeLong et al . hypothesise, with some empirical support, that the prokaryote value greater than one reflects an increase in genome size (and hence metabolic complexity) as organism mass increases; and that the protist value of one reflects a linear increase with size in ATP‐synthesising (energy‐generating) sites bound to membranes, which are surfaces. The metazoan value then reflects more conventional body surface or transport network constraints (DeLong et al ., 2010).
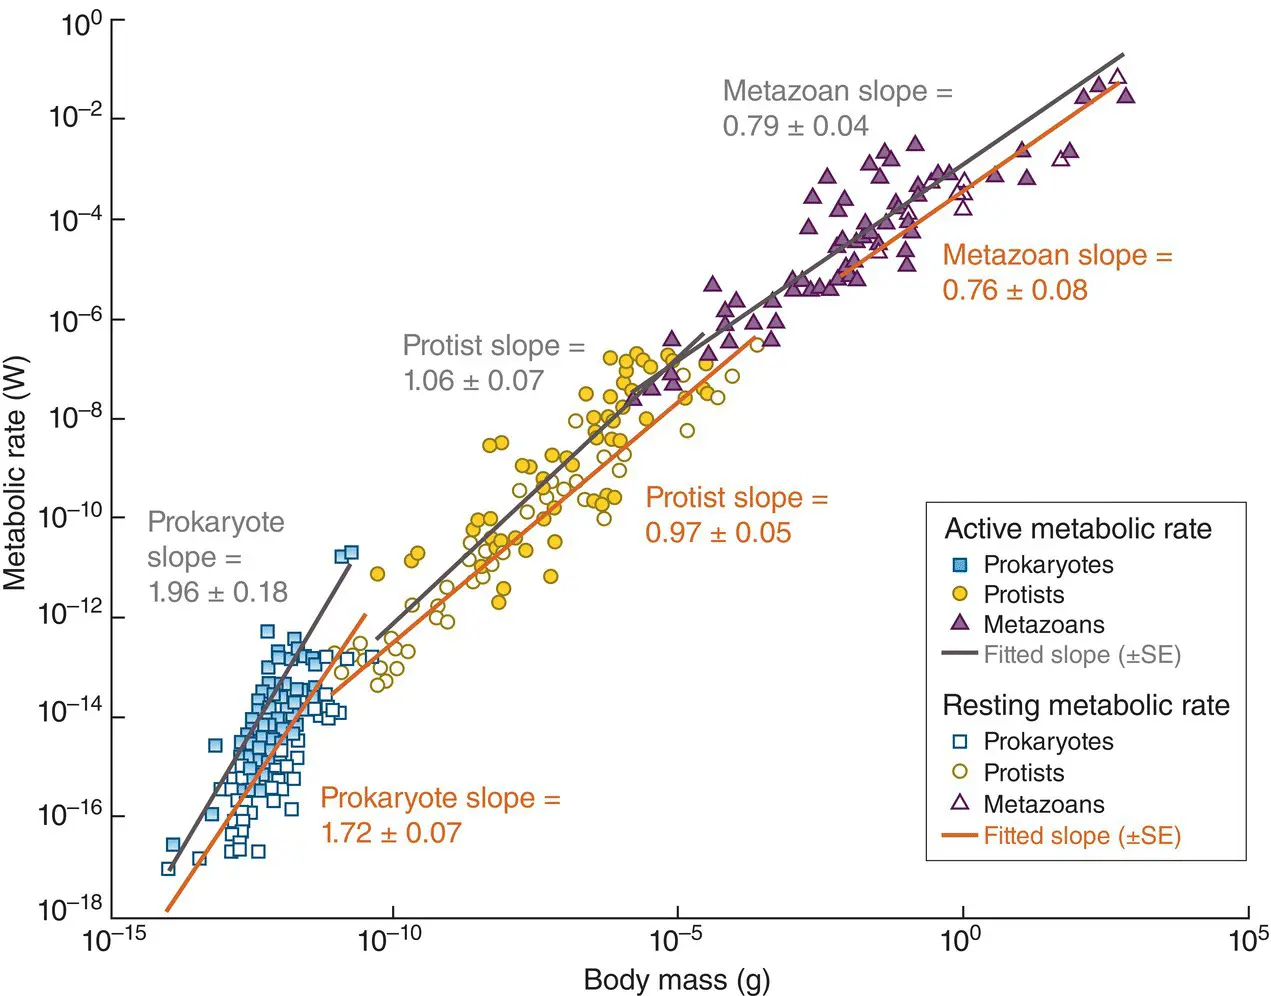
Figure 3.33 Relationships between metabolic rate and body mass for heterotrophic prokaryotes, protists and metazoans, plotted on logarithmic scales. The black lines and closed points are for active metabolic rates and the grey lines and open points for resting rates. In each case, the fitted slopes (± SE) are shown. All are significant ( P < 0.05).
Читать дальшеИнтервал:
Закладка:
Похожие книги на «Ecology»
Представляем Вашему вниманию похожие книги на «Ecology» списком для выбора. Мы отобрали схожую по названию и смыслу литературу в надежде предоставить читателям больше вариантов отыскать новые, интересные, ещё непрочитанные произведения.


Обсуждение, отзывы о книге «Ecology» и просто собственные мнения читателей. Оставьте ваши комментарии, напишите, что Вы думаете о произведении, его смысле или главных героях. Укажите что конкретно понравилось, а что нет, и почему Вы так считаете.