David Machin - Medical Statistics
Здесь есть возможность читать онлайн «David Machin - Medical Statistics» — ознакомительный отрывок электронной книги совершенно бесплатно, а после прочтения отрывка купить полную версию. В некоторых случаях можно слушать аудио, скачать через торрент в формате fb2 и присутствует краткое содержание. Жанр: unrecognised, на английском языке. Описание произведения, (предисловие) а так же отзывы посетителей доступны на портале библиотеки ЛибКат.
- Название:Medical Statistics
- Автор:
- Жанр:
- Год:неизвестен
- ISBN:нет данных
- Рейтинг книги:3 / 5. Голосов: 1
-
Избранное:Добавить в избранное
- Отзывы:
-
Ваша оценка:
Medical Statistics: краткое содержание, описание и аннотация
Предлагаем к чтению аннотацию, описание, краткое содержание или предисловие (зависит от того, что написал сам автор книги «Medical Statistics»). Если вы не нашли необходимую информацию о книге — напишите в комментариях, мы постараемся отыскать её.
Helpful multi-choice exercises are included at the end of each chapter, with answers provided at the end of the book. Each analysis technique is carefully explained and the mathematics kept to minimum. Written in a style suitable for statisticians and clinicians alike, this edition features many real and original examples, taken from the authors' combined many years' experience of designing and analysing clinical trials and teaching statistics.
Students of the health sciences, such as medicine, nursing, dentistry, physiotherapy, occupational therapy, and radiography should find the book useful, with examples relevant to their disciplines. The aim of training courses in medical statistics pertinent to these areas is not to turn the students into medical statisticians but rather to help them interpret the published scientific literature and appreciate how to design studies and analyse data arising from their own projects. However, the reader who is about to design their own study and collect, analyse and report on their own data will benefit from a clearly written book on the subject which provides practical guidance to such issues.
The practical guidance provided by this book will be of use to professionals working in and/or managing clinical trials, in academic, public health, government and industry settings, particularly medical statisticians, clinicians, trial co-ordinators. Its practical approach will appeal to applied statisticians and biomedical researchers, in particular those in the biopharmaceutical industry, medical and public health organisations.
Medical Statistics — читать онлайн ознакомительный отрывок
Ниже представлен текст книги, разбитый по страницам. Система сохранения места последней прочитанной страницы, позволяет с удобством читать онлайн бесплатно книгу «Medical Statistics», без необходимости каждый раз заново искать на чём Вы остановились. Поставьте закладку, и сможете в любой момент перейти на страницу, на которой закончили чтение.
Интервал:
Закладка:
2.6 Within‐Subject Variability
In Figure 2.1, measurements were made only once for each subject. Thus the variability, expressed, say, by the standard deviation, is the between‐subject variability. If, however, measurements are made repeatedly on one subject, we are assessing within‐subject variability.
Illustrative Example – Within‐Subject Variability – Total Steps per Day
Figure 2.10shows an example in which the total steps‐per‐day walked by one subject, assessed by a pedometer worn on the hip, was recorded every day for 100 days. The observed daily total step count is subject to day‐to‐day fluctuations. There is considerable day‐to‐day variation in steps but little evidence of any trend over time. Such variation is termed within‐subject variation . The within‐subject standard deviation in this case, is SD = 4959 steps with a mean daily step count of 14 107 steps over the 100 days.
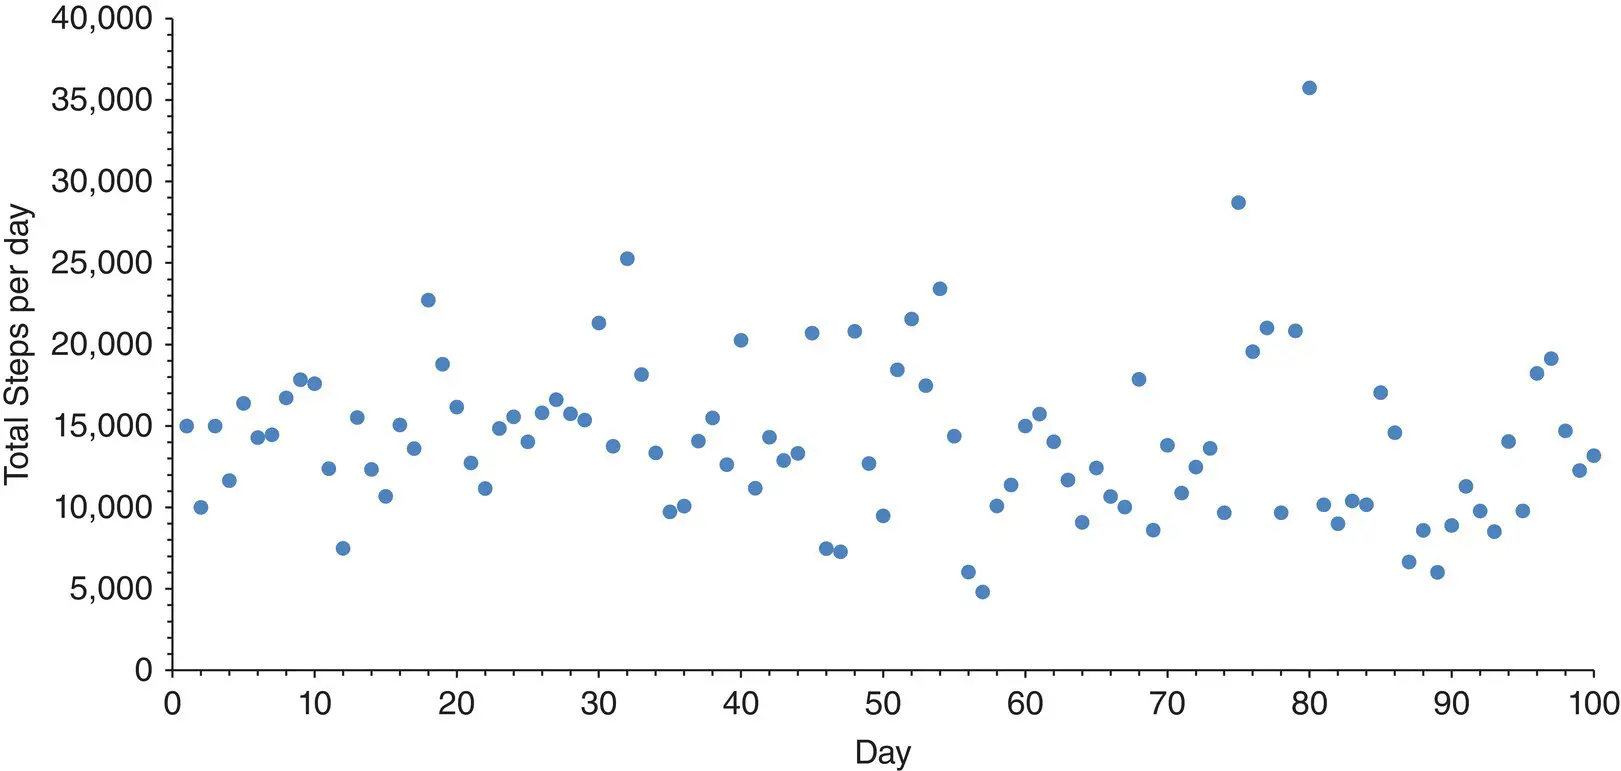
Figure 2.10 Total steps per day for 100 days for one participant in a global corporate challenge designed to increase physical activity.
If another subject had also completed this experiment, we could calculate their within‐subject variation as well, and perhaps compare the variabilities for the two subjects using these summary measures. Thus a second subject had a mean step count of 12 745 with standard deviation of 4861 steps, and so has a smaller mean but similar variability.
Successive within‐subject values are unlikely to be independent, that is, consecutive values will be dependent on values preceding them. For example, if a sedentary or inactive person records their step count on one day, then if the step count is low on one day it is likely to be low on the next day. This does not imply that the step count will be low, only that it is a good bet that it will be. In contrast, examples can be found in which high step counts are usually followed by lower values and vice versa. With independent observations, the step count on one day gives no indication or clue as to the step count on the next.
It is clear from Figure 2.10that the daily step counts are not constant over the observation period. This is nearly always the case when medical observations or measurements are taken over time. Such variation occurs for a variety of reasons. For example, the step count may depend critically on the day of the week, whether the subject was on holiday or at work, whether the subject was on medication or unwell. There may be observer‐to‐observer variation if the successive step counts were recorded by different personnel rather than always by the same person. There may be measuring device‐to‐measuring‐device variation if the successive step counts were recorded by different pedometers rather than always the same pedometer. The possibility of recording errors in the laboratory, transcription errors when conveying the results to the clinic or for statistical analysis, should not be overlooked in appropriate circumstances. When only a single observation is made on one patient at one time only, then the influences of the above sources of variation are not assessable, but may nevertheless all be reflected to some extent in the final entry in the patient's record.
Suppose successive observations on a patient with heart disease taken over time fluctuate around some more or less constant daily step count, then the particular level may be influenced by factors within the patient. For example, step counts (and physical activity levels) may be affected by the presence of a viral infection whose presence is unrelated to the cause of the heart disease itself. Levels may also be influenced by the severity of the underlying condition and whether concomitant treatment is necessary for the patient. Levels could also be influenced by other factors, for example, alcohol, tobacco consumption and diet. The cause of some of the variation in step counts may be identified and its effect on the variability estimated. Other variation may have no obvious explanation and is usually termed random variation. This does not necessarily imply there is no cause of this component of the variation but rather that its cause has not been identified or is being ignored.
Different patients with heart disease observed in the same way may have differing average levels of step counts (physical activity levels) from each other but with similar patterns of variation about these levels. The variation in mean step count levels from patient to patient is termed between‐subject variation .
Observations on different subjects are usually regarded as independent. That is, the data values on one subject are not influenced by those obtained from another. This, however, may not always be the case, particularly with subjective measures such as pain or quality of life which may be influenced by the subject's personal judgement, and different patients may assist each other when recording their quality of life.
In the investigation of total variability it is very important to distinguish within‐subject from between‐subject variability. In a study there may be measures made on different individuals and also repeatedly on the same individual. Between‐ and within‐ subject variation will always be present in any biological material, whether animals, healthy subjects, patients, or histological sections. The experimenter must be aware of possible sources which contribute to the variation, decide which are of importance in the intended study, and design the study appropriately.
2.7 Presentation
Graphs
In any graph there are clearly certain items that are important. For example, scales should be labelled clearly with appropriate dimensions added. The plotting symbols are also important; a graph is used to give an impression of pattern in the data, so bold and relatively large plotting symbols are desirable. This is particularly important if it is to be reduced for publication purposes or presented as a slide in a talk.
A graph should never include too much clutter; for example, many overlapping groups each with a different symbol. In such a case it is usually preferable to give a series of graphs, albeit smaller, in several panels. The choice of scales for the axes will depend on the particular data set. If transformations of the axes are used, for example, plotting on a log scale, it is usually better to mark the axes using the original units as this will be more readily understood by the reader. Breaks in scales should be avoided. If breaks are unavoidable under no circumstances must points on either side of a break be joined. If both axes have the same units, then use the same scale for each. If this cannot be done easily, it is sensible to indicate the line of equality, perhaps faintly in the figure. False impressions of trend, or lack of it, in a time plot can sometimes be introduced by omitting the zero point of the vertical axis. This may falsely make a mild trend, for example a change from 101 to 105, into an apparently strong trend (seemingly as though from 1 to 5). There must always be a compromise between clarity of reproduction that is filling the space available with data points and clarity of message. Appropriate measures of variability should also be included. One such is to indicate the range of values covered by two standard deviations each side of a plotted mean.
It is important to distinguish between a bar chart and a histogram. Bar charts display counts in mutually exclusive categories, and so the bars should have spaces between them. Histograms show the distribution of a continuous variable and so should not have spaces between the bars. It is not acceptable to use a bar‐chart to display a mean with standard error bars (see Chapter 6). These should be indicated with a data point surrounded with errors bars, or better still a 95% confidence interval.
Читать дальшеИнтервал:
Закладка:
Похожие книги на «Medical Statistics»
Представляем Вашему вниманию похожие книги на «Medical Statistics» списком для выбора. Мы отобрали схожую по названию и смыслу литературу в надежде предоставить читателям больше вариантов отыскать новые, интересные, ещё непрочитанные произведения.


Обсуждение, отзывы о книге «Medical Statistics» и просто собственные мнения читателей. Оставьте ваши комментарии, напишите, что Вы думаете о произведении, его смысле или главных героях. Укажите что конкретно понравилось, а что нет, и почему Вы так считаете.