Position, Navigation, and Timing Technologies in the 21st Century
Здесь есть возможность читать онлайн «Position, Navigation, and Timing Technologies in the 21st Century» — ознакомительный отрывок электронной книги совершенно бесплатно, а после прочтения отрывка купить полную версию. В некоторых случаях можно слушать аудио, скачать через торрент в формате fb2 и присутствует краткое содержание. Жанр: unrecognised, на английском языке. Описание произведения, (предисловие) а так же отзывы посетителей доступны на портале библиотеки ЛибКат.
- Название:Position, Navigation, and Timing Technologies in the 21st Century
- Автор:
- Жанр:
- Год:неизвестен
- ISBN:нет данных
- Рейтинг книги:5 / 5. Голосов: 1
-
Избранное:Добавить в избранное
- Отзывы:
-
Ваша оценка:
Position, Navigation, and Timing Technologies in the 21st Century: краткое содержание, описание и аннотация
Предлагаем к чтению аннотацию, описание, краткое содержание или предисловие (зависит от того, что написал сам автор книги «Position, Navigation, and Timing Technologies in the 21st Century»). Если вы не нашли необходимую информацию о книге — напишите в комментариях, мы постараемся отыскать её.
Volume 1 of
contains three parts and focuses on the satellite navigation systems, technologies, and engineering and scientific applications. It starts with a historical perspective of GPS development and other related PNT development. Current global and regional navigation satellite systems (GNSS and RNSS), their inter-operability, signal quality monitoring, satellite orbit and time synchronization, and ground- and satellite-based augmentation systems are examined. Recent progresses in satellite navigation receiver technologies and challenges for operations in multipath-rich urban environment, in handling spoofing and interference, and in ensuring PNT integrity are addressed. A section on satellite navigation for engineering and scientific applications finishes off the volume.
Volume 2 of
consists of three parts and addresses PNT using alternative signals and sensors and integrated PNT technologies for consumer and commercial applications. It looks at PNT using various radio signals-of-opportunity, atomic clock, optical, laser, magnetic field, celestial, MEMS and inertial sensors, as well as the concept of navigation from Low-Earth Orbiting (LEO) satellites. GNSS-INS integration, neuroscience of navigation, and animal navigation are also covered. The volume finishes off with a collection of work on contemporary PNT applications such as survey and mobile mapping, precision agriculture, wearable systems, automated driving, train control, commercial unmanned aircraft systems, aviation, and navigation in the unique Arctic environment.
In addition, this text:
Serves as a complete reference and handbook for professionals and students interested in the broad range of PNT subjects Includes chapters that focus on the latest developments in GNSS and other navigation sensors, techniques, and applications Illustrates interconnecting relationships between various types of technologies in order to assure more protected, tough, and accurate PNT
will appeal to all industry professionals, researchers, and academics involved with the science, engineering, and applications of position, navigation, and timing technologies.pnt21book.com
Position, Navigation, and Timing Technologies in the 21st Century — читать онлайн ознакомительный отрывок
Ниже представлен текст книги, разбитый по страницам. Система сохранения места последней прочитанной страницы, позволяет с удобством читать онлайн бесплатно книгу «Position, Navigation, and Timing Technologies in the 21st Century», без необходимости каждый раз заново искать на чём Вы остановились. Поставьте закладку, и сможете в любой момент перейти на страницу, на которой закончили чтение.
Интервал:
Закладка:
At this point, a communications receiver goes on with channel equalization, which scales the received symbol frequency response with the inverse of the estimated channel frequency response at all data OFDM subcarriers to obtain the equalized symbol subcarriers, from which information data bits are demodulated after de‐mapping, de‐interleaving, and decoding, among other necessary steps. On the other hand, a PNT receiver can apply a suitable method to obtain TOA measurements for ranging and positioning as described below.
An open‐loop TOA estimation scheme consists of applying the inverse FFT (IFFT) to the estimated frequency response at all data OFDM subcarriers, zero‐padded to cover the guard bands, to produce the channel impulse response (CIR), which describes the multipath signals in terms of their strength and delay relative to the start of the sliding window. The peak location of either the earliest arrival (above a detection threshold) or the strongest arrival can be taken for coarse TOA estimation through interpolation via a quadratic or sinc‐function curve fitting to within a fractional of a sample (about 0.11 μs for the 8K mode or 30 m) [49].
A more elaborate method to estimate the multipath signal parameters is to apply the matching pursuit (MP) algorithm [50] to the CIR [9, 10, 51, 52] in the time domain or the order‐recursive least‐square matching pursuit algorithm [53] to the channel transfer function [54] in the frequency domain. The estimated multipath signal parameters are then used to initialize a number of DLLs to track the delay of dominant signals for multipath resolution and refined TOA estimation [9, 10, 51, 52, 54]. Similar methods are used for 4G LTE signals [55, 56] and GNSS signals [57–59].
Although individual OFDM symbols are generated and processed almost independently, the signal stream is continuous in a framed OFDM system. As a result, the TOA of OFDM symbols can be tracked from symbol to symbol over time, which can be implemented either based on the pilot component or on the full symbol. In pilot‐carriers‐based delay tracking for refined TOA estimation (the lower‐middle part of Figure 40.10), the received pilot carriers are correlated with early, prompt, and late versions of the locally generated pilots. The normalized early minus late (EML) correlation power serves as the delay error discriminator, which drives a low‐pass loop filter. The filtered delay error is then used to correct the received pilot components so as to align up with the locally generated ones, thus closing the tracking loop [51, 52, 54].
In decision‐directed delay tracking for refined TOA estimation (the lower‐left part of Figure 40.10), the correlation is made between the received full OFDM symbol and the one reconstructed from the demodulated data (the signal path to @ in the right part of Figure 40.10) [60, 61]. However, the latency in decoding and de‐interleaving may degrade the tracking performance. A simpler method is to use hard data decisions on equalized symbols (the signal path in the dashed line to @ in Figure 40.10). Decision‐directed delay tracking offers two advantages. First, the use of full OFDM symbols in correlation involves more subcarriers, particularly high‐frequency components, which tend to sharpen the correlation peak while lowering the side lobes. Second, it allows for a time‐domain implementation of tracking in addition to the frequency‐domain implementation (the dashed line from the frequency‐domain OFDM symbols) similar to the above‐described pilot‐carriers‐based delay tracking. In the time domain, a joint time and frequency tracking loop can be implemented, operating on the time samples independent of the communications receiver except for data bits.
Sample results of processing in‐the‐air DVB‐T signals are presented below. The correlation functions of various components of an OFDM symbol are shown in Figure 40.11. In Figure 40.11(a), the correlation function for the scattered pilots of an OFDM symbol is shown. Since the scattered pilots are inserted once every 12 carriers, their time‐domain waveform has a periodicity of N FFT/12, and so does their correlation function. The details of the correlation peak are shown in Figure 40.11(b). As long as the initial STO is less than 1/12th of a symbol duration, there is no ambiguity in determining the peak.
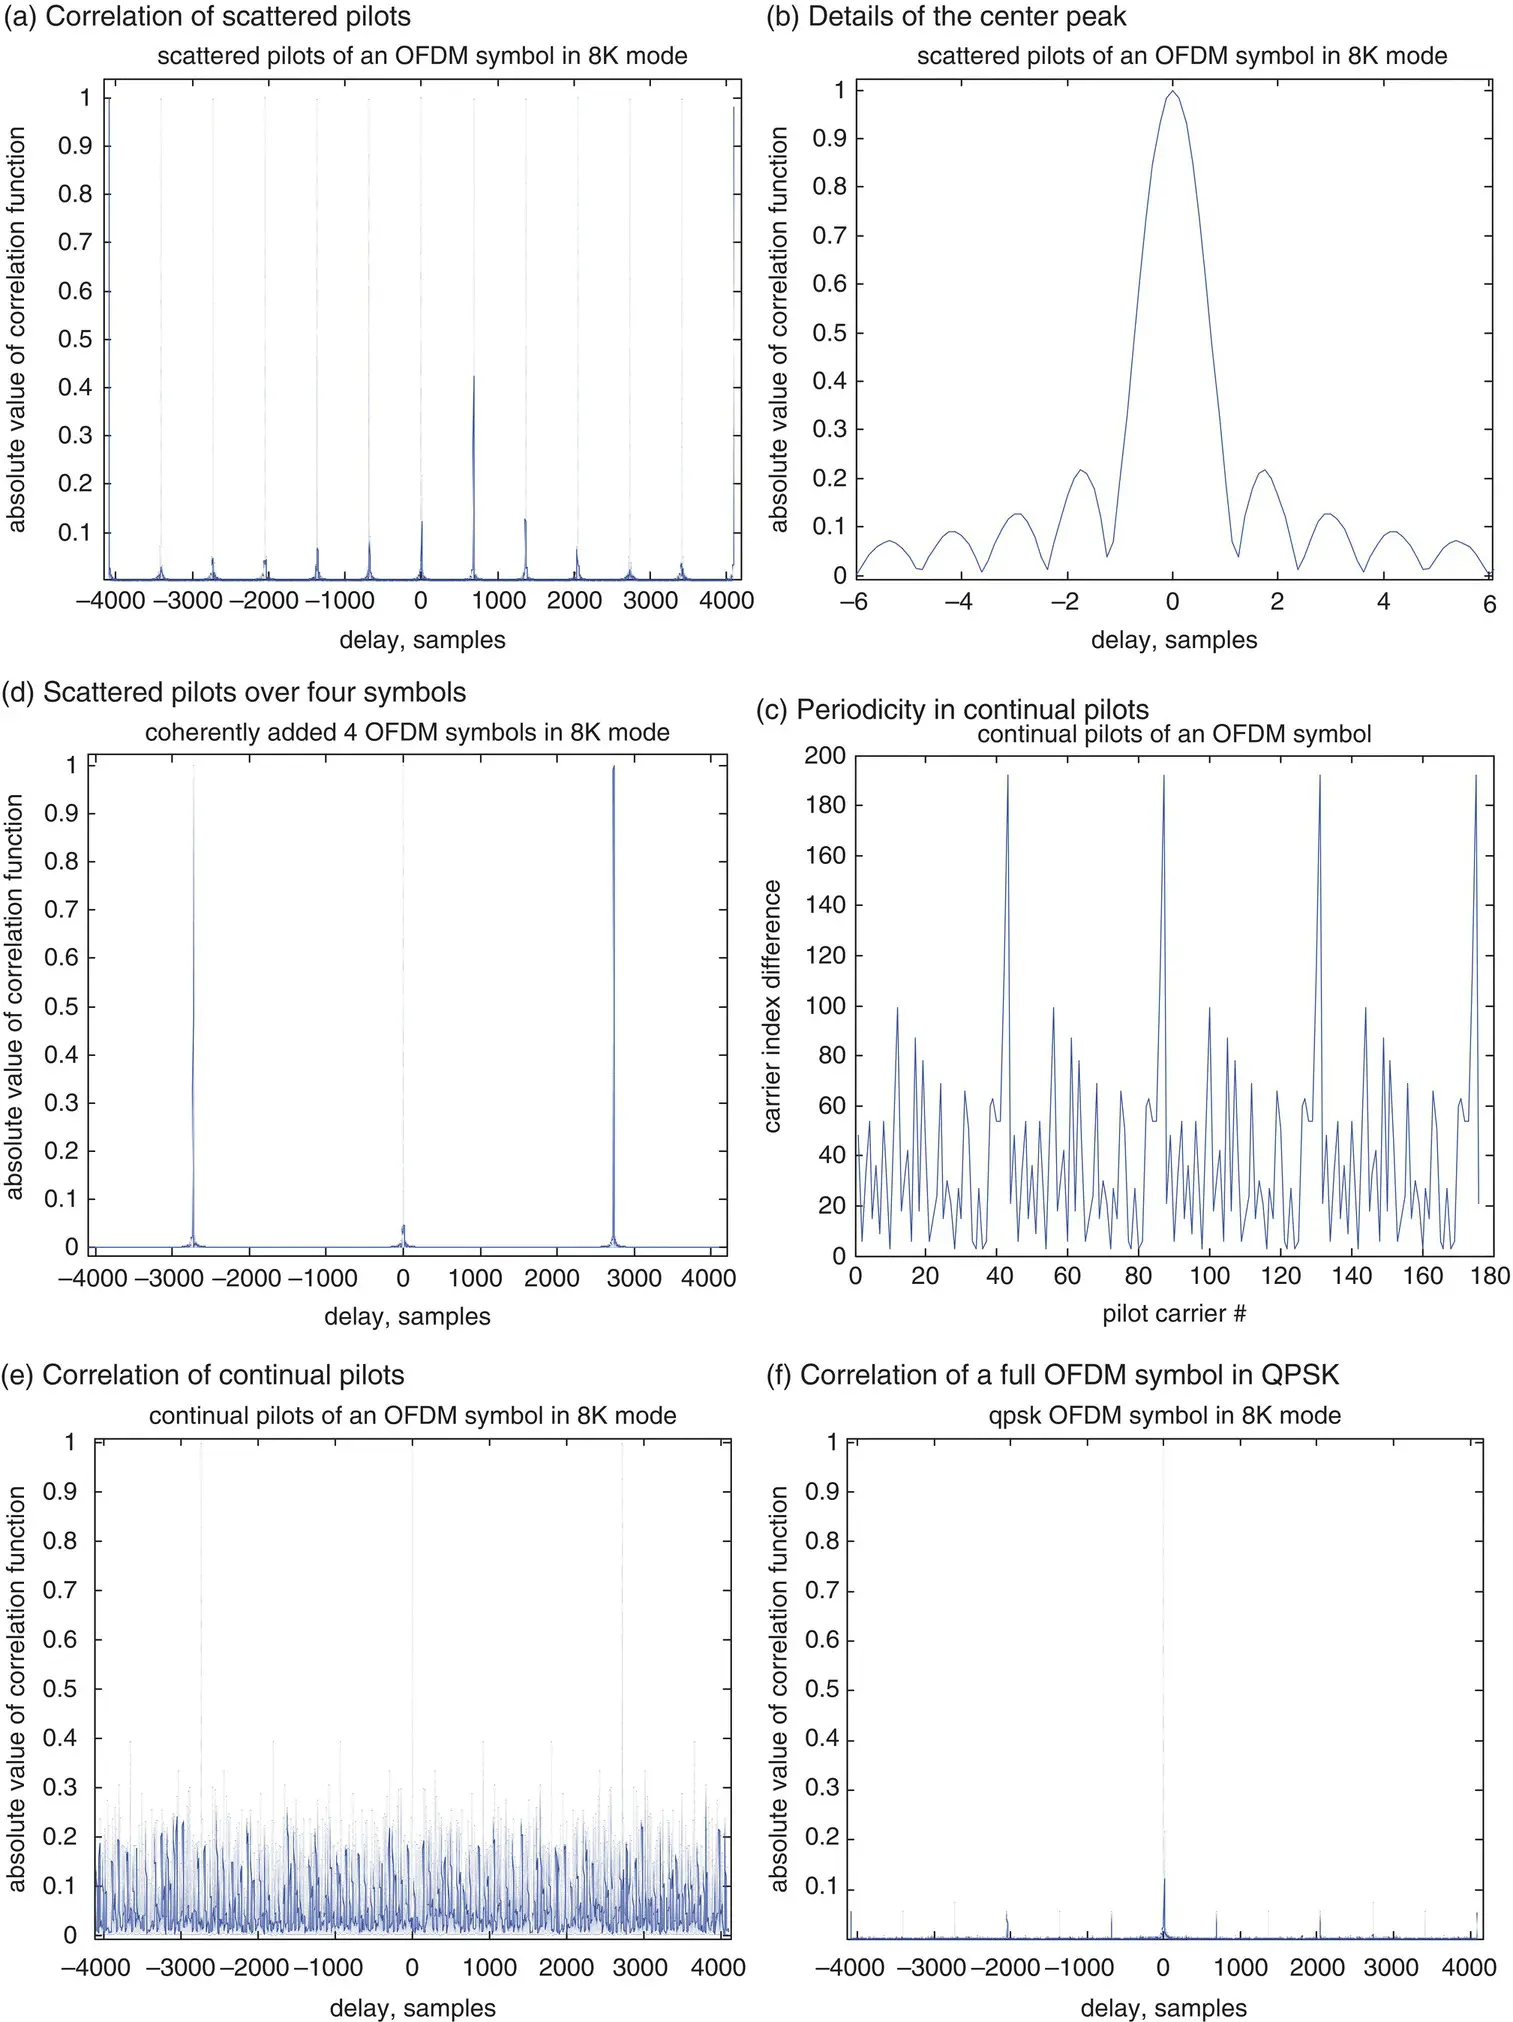
Figure 40.11 Ideal correlation functions for various components of an OFDM symbol.
When the correlation functions of scattered pilots in four consecutive symbols are coherently summed, the resulting function has a periodicity of N FFT/3 as shown in Figure 40.11(c), which is because the pattern of aggregated scattered pilots has a spacing of three carriers. The correlation peak maintains the same shape, but the unambiguous interval increases by a factor of 4.
The difference between continual pilot carrier indexes is shown in Figure 40.11(d), which exhibits repetition in frequency. The correlation function of continual pilots of an OFDM symbol is shown in Figure 40.11(e), which has the same periodicity as in Figure 40.11(c) but with a raised level of cross‐correlation due to spectral leakage of its irregular subcarrier placement. It is one reason why only scattered pilots are used in correlation tracking for refined TOA estimation.
The correlation function of a full OFDM symbol with all subcarriers is shown in Figure 40.11(f), where the continual and scattered pilots have an amplitude factor of 4/3 while data subcarriers of unity amplitude are drawn randomly from a QPSK constellation of z = (1/  )(±1 ± j ). The resulting correlation peak is similar to Figure 40.11(b), but the periodic peaks are significantly suppressed (below the fourth sidelobe). The full OFDM correlation can be used for decision‐directed tracking for refined TOA estimation as illustrated in Figure 40.10.
A field test for tracking DVB‐T signals was run in Marseille, France [54]. The spectrum of an ideal DVB‐T signal in the 8K mode is compared to that of sampled signals as shown in the top and bottom plots of Figure 40.12(a), respectively. Within the effective bandwidth of 8 MHz, the null margins used to avoid out‐of‐band emissions and pilot subcarriers with boosted power are clearly visible. The cross‐correlation of the cyclic prefix in the guard interval with that at the end of the symbol useful part, averaged over four OFDM symbols, is shown in Figure 40.12(b), where the correlation peak is located at the 1564th sample (the top plot), and the factional CFO is estimated to be 0.00012 rads/s from the corresponding differential phase (the bottom plot).
After cyclic prefix removal, the FFT is applied to the samples in the useful part. The continual pilot pattern is used to estimate the integer CFO over two consecutive OFDM symbols, while the scattered pilot pattern for each OFDM symbol is detected after CFO correction. Figure 40.12(c) shows the CIR (the blue curve) estimated from an OFDM symbol as a snapshot of multipath acquisition. The threshold (the black dash line) is set as 80% of the total power within the acquisition region to detect possible paths (the red circled line). The first path is declared among all acquired paths according to their rate of occurrence. In this particular case, the paths arriving at 1564.5, 1565.5, and 1566.5 in samples are the three most frequently detected ones with their occurrence probability equal to 1, and the earliest arrival is at the 1564.5th sample. This path is then used to initiate the DLL tracking with the 20 s tracking results shown in Figure 40.12(d). As shown, the 95% accuracy is within 0.95 m with an estimated C/N 0of 57.97 dB‐Hz.
Читать дальшеИнтервал:
Закладка:
Похожие книги на «Position, Navigation, and Timing Technologies in the 21st Century»
Представляем Вашему вниманию похожие книги на «Position, Navigation, and Timing Technologies in the 21st Century» списком для выбора. Мы отобрали схожую по названию и смыслу литературу в надежде предоставить читателям больше вариантов отыскать новые, интересные, ещё непрочитанные произведения.


Обсуждение, отзывы о книге «Position, Navigation, and Timing Technologies in the 21st Century» и просто собственные мнения читателей. Оставьте ваши комментарии, напишите, что Вы думаете о произведении, его смысле или главных героях. Укажите что конкретно понравилось, а что нет, и почему Вы так считаете.