Coastal Ecosystems in Transition
Здесь есть возможность читать онлайн «Coastal Ecosystems in Transition» — ознакомительный отрывок электронной книги совершенно бесплатно, а после прочтения отрывка купить полную версию. В некоторых случаях можно слушать аудио, скачать через торрент в формате fb2 и присутствует краткое содержание. Жанр: unrecognised, на английском языке. Описание произведения, (предисловие) а так же отзывы посетителей доступны на портале библиотеки ЛибКат.
- Название:Coastal Ecosystems in Transition
- Автор:
- Жанр:
- Год:неизвестен
- ISBN:нет данных
- Рейтинг книги:3 / 5. Голосов: 1
-
Избранное:Добавить в избранное
- Отзывы:
-
Ваша оценка:
Coastal Ecosystems in Transition: краткое содержание, описание и аннотация
Предлагаем к чтению аннотацию, описание, краткое содержание или предисловие (зависит от того, что написал сам автор книги «Coastal Ecosystems in Transition»). Если вы не нашли необходимую информацию о книге — напишите в комментариях, мы постараемся отыскать её.
coastal ecosystems are responding to the pressures of human expansion
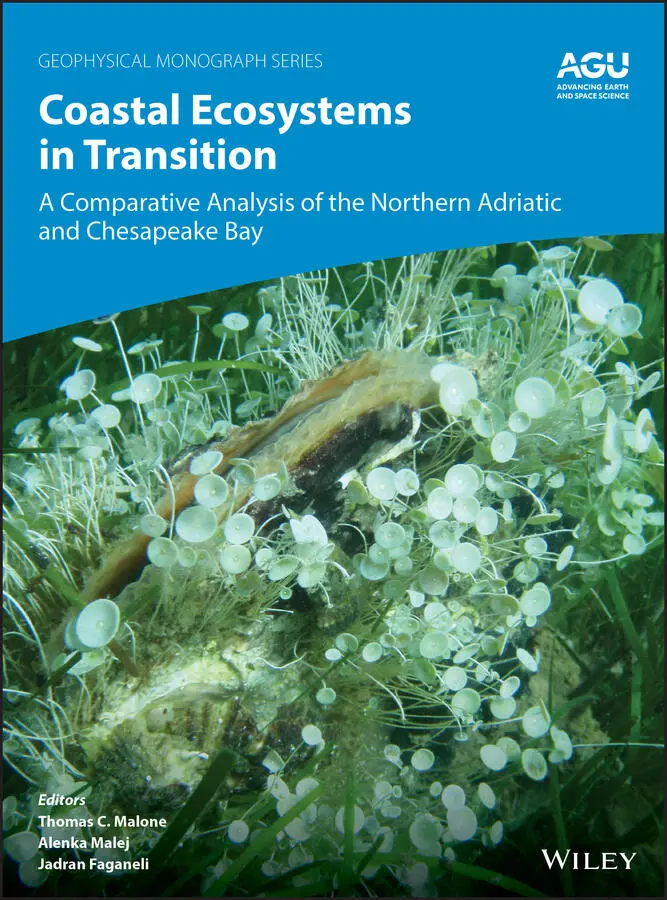
The Northern Adriatic Sea, a continental shelf ecosystem in the Northeast Mediterranean Sea, and the Chesapeake Bay, a major estuary of the mid-Atlantic coast of the United States, are semi-enclosed, river-dominated ecosystems with urbanized watersheds that support extensive industrial agriculture.
Coastal Ecosystems in Transition: A Comparative Analysis of the Northern Adriatic and Chesapeake Bay Volume highlights include:
Effects of nutrient enrichment and climate-driven changes on critical coastal habitats Patterns of stratification and circulation Food web dynamics from phytoplankton to fish Nutrient cycling, water quality, and harmful algal events Causes and consequences of interannual variability The American Geophysical Union promotes discovery in Earth and space science for the benefit of humanity. Its publications disseminate scientific knowledge and provide resources for researchers, students, and professionals.
Coastal Ecosystems in Transition — читать онлайн ознакомительный отрывок
Ниже представлен текст книги, разбитый по страницам. Система сохранения места последней прочитанной страницы, позволяет с удобством читать онлайн бесплатно книгу «Coastal Ecosystems in Transition», без необходимости каждый раз заново искать на чём Вы остановились. Поставьте закладку, и сможете в любой момент перейти на страницу, на которой закончили чтение.
Интервал:
Закладка:
5 Chapter 5Figure 5.1 Mean annual concentrations of total nitrogen (TN) and NO x(dissol...Figure 5.2 Po River daily (grey line) and annual average (triangles) dischar...Figure 5.3 Average annual cycles of (a) surface, (b) water‐column average, a...Figure 5.4 Annual cycles of surface chlorophyll‐ a (Chl‐ a ) at two Chesapeake ...Figure 5.5 Decadal changes in mean (±95% CI) surface chlorophyll‐ a (Chl‐ a ) c...Figure 5.6 Box plots showing median, interquartile range, and total range of...Figure 5.7 Interannual occurrence and duration in mucilaginous macroaggregat...Figure 5.8 Average annual cycles of bottom dissolved oxygen concentration by...Figure 5.9 Vertical cross‐sections of dissolved oxygen concentration along t...Figure 5.10 Time series of July hypoxic (O 2< 2 mg L −1) volume in Ches...Figure 5.11 Dissolved oxygen in bottom waters of the Gulf of Trieste (sampli...Figure 5.12 Dissolved oxygen in bottom waters of the northern Adriatic Sea (...Figure 5.13 Frequency of days with hypoxia (%) in coastal waters of Emilia‐R...Figure 5.14 Time series of nutrient loads, surface chlorophyll‐ a (Chl‐ a ), di...Figure 5.15 Time series as in Figure 5.14, but for three additional regions ...Figure 5.16 Long‐term changes in surface water pH (a–c) and temperature (d–f...Figure 5.17 Total alkalinity (TA) versus salinity in surface waters of the n...Figure 5.18 Nomogram of total alkalinity (TA) versus dissolved inorganic car...
6 Chapter 6Figure 6.1 Means and standard deviations (top panel, annual means; bottom pa...Figure 6.2 Mean abundance (individuals m −3) of mesozooplankton at five...Figure 6.3 Stable nitrogen (N) composition of bulk net mesozooplankton and s...Figure 6.4 Annual anomalies of near‐surface seawater temperature (bars; modi...
7 Chapter 7Figure 7.1 (Left) Key study sites in the northern Adriatic Sea: Triangles, s...
8 Chapter 8Figure 8.1 Pelite (clay and silt) and organic carbon content in the surface ...Figure 8.2 Chlorophyll‐ a and particulate organic carbon concentrations along...Figure 8.3 Temporal variations in particulate organic carbon concentration n...Figure 8.4 Seasonal cycle of vertically integrated gross primary production ...Figure 8.5 (Left) Seasonal variations in mean sedimentation rates of particu...Figure 8.6 (Top and middle) Time series of annual averages for observed (bla...Figure 8.7 (a) Average biomass (ash‐free dry weight (AFDW) g m −2; gran...Figure 8.8 Seasonal patterns of sediment oxygen consumption; benthic fluxes ...Figure 8.9 Countour maps of seasonal diffusive fluxes of ammonium and phosph...Figure 8.10 Seasonal patterns of benthic fluxes of dissolved inorganic carbo...Figure 8.11 Temporal variations of solute concentrations in the sediment ove...Figure 8.12 Annual mean (± SD) cycles of sediment–water (a) ammonium, (b) ni...Figure 8.13 Spatial variation in sediment–water fluxes of ammonium and phosp...Figure 8.14 Relationship between dissolved oxygen concentrations in overlyin...Figure 8.15 Relationships between total organic matter (OM) inputs (i.e., au...
9 Chapter 9Figure 9.1 Seagrass abundance in Chesapeake Bay, 1978–2017: nd and id indica...Figure 9.2 Map of Chesapeake Bay showing the distribution of seagrass meadow...
10 Chapter 10Figure 10.1 Total and national catch from FAO Area 37.2.1 (GFCM, 2018): (lef...Figure 10.2 Total commercial harvest of finfish and shellfish in Chesapeake ...Figure 10.3 Yearly catch in FAO Area 37.2.1 Adriatic Sea of anchovy Engrauli ...Figure 10.4 Commercial catch of Atlantic menhaden and other pelagic finfish ...Figure 10.5 Yearly catch in FAO Area 37.2.1 Adriatic Sea of European hake Me ...Figure 10.6 Yearly catch of miscellaneous coastal fish in FAO Area 37.2.1 Ad...Figure 10.7 Yearly catch of sharks, rays and chimaeras in FAO Area 37.2.1 Ad...Figure 10.8 Trends in commercial catch for three main demersal finfish in Ch...Figure 10.9 Yearly catch of river eel in FAO Area 37.2.1 Adriatic Sea (GFCM,...Figure 10.10 Trends in commercial catch of anadromous (striped bass, white p...Figure 10.11 Yearly catch of striped Venus clam Chamelea gallina in FAO Area...Figure 10.12 Yearly catch of squid Illex coindetii and octopus Octopus vulga ...Figure 10.13 Yearly catch (metric tons) of Norway lobster Nephrops norvegicu ...Figure 10.14 Commercial catch of crustaceans and mollusks (upper panel) and ...Figure 10.15 Phase diagram of pelagic and benthic fisheries harvest in Chesa...Figure 10.16 Time series of pelagic/benthic (P/B) fisheries catch biomass ra...
Guide
1 Cover Page
2 Series Page
3 Title Page Geophysical Monograph 256
4 Copyright
5 LIST OF CONTRIBUTORS
6 PREFACE
7 Table of Contents
8 Begin Reading
9 Index
10 WILEY END USER LICENSE AGREEMENT
Pages
1 ii
2 iii
3 iv
4 vii
5 viii
6 ix
7 xi
8 1
9 2
10 3
11 4
12 5
13 6
14 7
15 8
16 9
17 10
18 11
19 12
20 13
21 14
22 15
23 16
24 17
25 18
26 19
27 21
28 22
29 23
30 24
31 25
32 26
33 27
34 28
35 29
36 30
37 31
38 32
39 33
40 34
41 35
42 36
43 37
44 38
45 39
46 40
47 41
48 42
49 43
50 44
51 45
52 46
53 47
54 48
55 49
56 50
57 51
58 52
59 53
60 54
61 55
62 56
63 57
64 58
65 59
66 60
67 61
68 62
69 63
70 64
71 65
72 66
73 67
74 68
75 69
76 70
77 71
78 72
79 73
80 74
81 75
82 76
83 77
84 78
85 79
86 80
87 81
88 82
89 83
90 84
91 85
92 86
93 87
94 88
95 89
96 90
97 91
98 92
99 93
100 94
101 95
102 96
103 97
104 98
105 99
106 100
107 101
108 102
109 103
110 104
111 105
112 106
113 107
114 108
115 109
116 110
117 111
118 112
119 113
120 114
121 115
122 116
123 117
124 118
125 119
126 120
127 121
128 122
129 123
130 124
131 125
132 126
133 127
134 129
135 130
136 131
137 132
138 133
139 134
140 135
141 136
142 137
143 138
144 139
145 140
146 141
147 142
148 143
149 144
150 145
151 147
152 148
153 149
154 150
155 151
156 152
157 153
158 154
159 155
160 156
161 157
162 158
163 159
164 160
165 161
166 162
167 163
168 164
169 165
170 166
171 167
172 168
173 169
174 170
175 171
176 172
177 173
178 174
179 175
180 177
181 178
182 179
183 180
184 181
185 182
186 183
187 184
188 185
189 186
190 187
191 188
192 189
193 190
194 191
195 192
196 193
197 194
198 195
199 196
200 197
201 198
202 199
203 200
204 201
205 202
206 203
207 204
208 205
209 206
210 207
211 208
212 209
213 210
214 211
215 212
216 213
217 214
218 215
219 216
220 217
221 218
222 219
223 220
224 221
225 222
226 223
227 224
228 225
Читать дальшеИнтервал:
Закладка:
Похожие книги на «Coastal Ecosystems in Transition»
Представляем Вашему вниманию похожие книги на «Coastal Ecosystems in Transition» списком для выбора. Мы отобрали схожую по названию и смыслу литературу в надежде предоставить читателям больше вариантов отыскать новые, интересные, ещё непрочитанные произведения.


Обсуждение, отзывы о книге «Coastal Ecosystems in Transition» и просто собственные мнения читателей. Оставьте ваши комментарии, напишите, что Вы думаете о произведении, его смысле или главных героях. Укажите что конкретно понравилось, а что нет, и почему Вы так считаете.