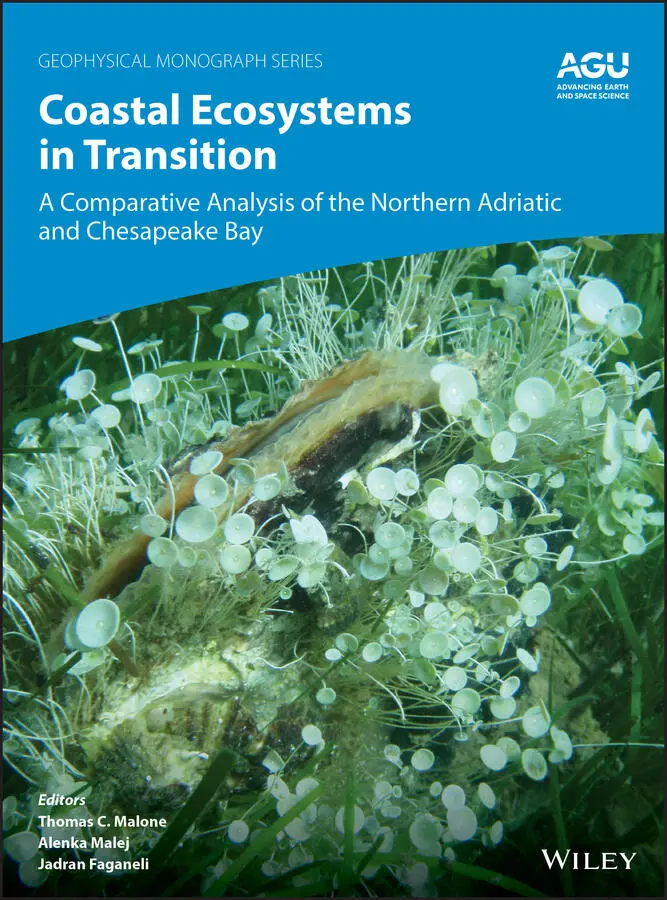
Coastal Ecosystems in Transition
Здесь есть возможность читать онлайн «Coastal Ecosystems in Transition» — ознакомительный отрывок электронной книги совершенно бесплатно, а после прочтения отрывка купить полную версию. В некоторых случаях можно слушать аудио, скачать через торрент в формате fb2 и присутствует краткое содержание. Жанр: unrecognised, на английском языке. Описание произведения, (предисловие) а так же отзывы посетителей доступны на портале библиотеки ЛибКат.
- Название:Coastal Ecosystems in Transition
- Автор:
- Жанр:
- Год:неизвестен
- ISBN:нет данных
- Рейтинг книги:3 / 5. Голосов: 1
-
Избранное:Добавить в избранное
- Отзывы:
-
Ваша оценка:
Coastal Ecosystems in Transition: краткое содержание, описание и аннотация
Предлагаем к чтению аннотацию, описание, краткое содержание или предисловие (зависит от того, что написал сам автор книги «Coastal Ecosystems in Transition»). Если вы не нашли необходимую информацию о книге — напишите в комментариях, мы постараемся отыскать её.
coastal ecosystems are responding to the pressures of human expansion
The Northern Adriatic Sea, a continental shelf ecosystem in the Northeast Mediterranean Sea, and the Chesapeake Bay, a major estuary of the mid-Atlantic coast of the United States, are semi-enclosed, river-dominated ecosystems with urbanized watersheds that support extensive industrial agriculture.
Coastal Ecosystems in Transition: A Comparative Analysis of the Northern Adriatic and Chesapeake Bay Volume highlights include:
Effects of nutrient enrichment and climate-driven changes on critical coastal habitats Patterns of stratification and circulation Food web dynamics from phytoplankton to fish Nutrient cycling, water quality, and harmful algal events Causes and consequences of interannual variability The American Geophysical Union promotes discovery in Earth and space science for the benefit of humanity. Its publications disseminate scientific knowledge and provide resources for researchers, students, and professionals.
Coastal Ecosystems in Transition — читать онлайн ознакомительный отрывок
Ниже представлен текст книги, разбитый по страницам. Система сохранения места последней прочитанной страницы, позволяет с удобством читать онлайн бесплатно книгу «Coastal Ecosystems in Transition», без необходимости каждый раз заново искать на чём Вы остановились. Поставьте закладку, и сможете в любой момент перейти на страницу, на которой закончили чтение.
Интервал:
Закладка:
Table 1.1 Mean riverine inputs and physical and ecological characteristics of CB and the NAS
| Riverborne inputs | Po River | Susquehanna River |
| Freshwater input (km 3year −1) | 46 | 36 |
| Total N input (10 6kg year −1) | 164 | 63 |
| Mean total P input (10 6kg year −1) | 8.8 | 2.8 |
| Mean NO xinput (10 6kg year −1) | 105 | 43 |
| Mean dissolved inorganic P input (10 6kg year −1) | 3.0 | 0.4 |
| Physical characteristics | NAS | CB |
| Length × mean width (km) | 135 × 135 | 320 × 20 |
| Mean depth (m) | 33.5 | 8.4 |
| Surface area (km 2) | 18,900 | 6500 |
| Volume (km 3) | 635 | 50 |
| Surface area/volume (km −1) | 30 | 130 |
| Dominant circulation pattern | Cyclonic gyres | Partially stratified, estuarine |
| Euphotic zone depth (m) | 10–55 | 3–10 |
| Phytoplankton | NAS | CB |
| Mean surface chlorophyll‐ a (μg L −1) | 1.5 | 9.5 |
| Mean phytoplankton production (g C m −2year −1) | 90 | 450 |
Note: NO x= dissolved nitrate + nitrite.
The parameters of nutrient recycling via pelagic–benthic interactions include net phytoplankton production, deposition of particulate organic matter (POM), benthic respiration, and benthic nutrient regeneration. While phytoplankton production is fivefold higher in CB than in the NAS, benthic community carbon respiration rates are fourfold higher in CB than in the NAS and differences in sediment nitrogen recycling rates (as NH 4 +) are sevenfold to 15‐fold higher in CB. At the same time, rates of denitrification are nearly identical in the two systems. Thus, when normalized to the rate of respiration, the rate of denitrification (and potential loss of nitrogen to the atmosphere via the release of nitrous oxide and dinitrogen gas) is much higher in the NAS than in CB.
1.2.3. Effects of Nutrient Enrichment
1.2.3.1. Phytoplankton Production
Annual cycles and interannual variability of phytoplankton biomass and primary productivity in CB and the NAS are driven by variations in riverine inputs of buoyancy and nutrients. Differences in circulation patterns and geomorphology are reflected in contrasting patterns and levels of eutrophication. Despite having a much lower annual nutrient load than the NAS, annual phytoplankton production is five times higher in CB than in the NAS. Chesapeake Bay is eutrophic system‐wide while eutrophication in the NAS is confined to the western NAS, which is directly influenced by the Po River. Receiving waters of CB effectively sequester riverborne nutrient inputs into phytoplankton biomass, and efficiently retain and recycle phytoplankton biomass produced in spring (dominated by diatoms) to support high primary productivity during summer. The seasonal accumulation of biomass during spring also fuels the annual occurrence of extensive bottom‐water oxygen depletion during summer in CB. In contrast, seasonal increases in phytoplankton biomass and primary productivity are much lower in the NAS, and bottom‐water oxygen depletion is more sporadic in time and space—patterns that reflect the rapid dilution of riverborne nutrient inputs in the NAS. Dinoflagellate blooms occur most frequently under stratified conditions in both systems. However, in contrast to CB, the formation of large organic aggregates in the NAS (“mare sporco”) during some years displaces the normally frequent dinoflagellate blooms of the summer.
Since 1729, mare sporco following the spring diatom bloom occurred relatively infrequently (1729, 1872, 1880, 1903, 1930, 1949) compared with the late 1970s through the 1990s (1976, 1983, 1988, 1989, 1991, and 1997), perhaps as a consequence of nutrient enrichment, i.e., they tend to occur under high phytoplankton production, fueled by Po River nutrient inputs during spring and summer, leading to the formation of mucus mats that are transported eastward resulting in episodic deposition of POM and the development of isolated patches of bottom‐water anoxia. The location of these mass mortalities varies throughout the season and from year to year, but their cumulative impact results in widespread benthic mortalities in the NAS.
1.2.3.2. Shallow Water Habitats
Like many sublittoral zones worldwide, both systems have experienced dramatic declines in the spatial extent of tidal marshes and submerged aquatic vegetation (seagrass meadows and indigenous macroalgae) as a consequence of cultural eutrophication, coastal development, and sea‐level rise. In this regard, it is noteworthy that relative sea‐level rise (due to both subsidence and eustatic sea‐level rise) is similar in both systems (1.2–8.5 mm year −1in the NAS and 3.2–4.7 mm year −1in CB). Seagrass meadows that once covered ~190 km 2in the north and eastern NAS began to disappear in the 1970s. Today only isolated patches exist in scattered locations in the eastern NAS. Likewise, seagrass meadows, once abundant in CB (~750 km 2), have been in decline since 1972 when runoff from a tropical storm transported massive amounts of nutrients into the bay. In 1984, seagrass area was estimated to be ~160 km 2. This sustained loss of seagrass habitat during the 1970s and 1980s was primarily due to nutrient enrichment and associated growth of phytoplankton and epiphytic algae that reduced the amount of light available to the grasses. In the NAS, kelp and seagrass meadows along the eastern margin are being lost with some being replaced by turf forming species.
1.2.3.3. Planktonic Consumers
The abundances of microzooplankton populations in the NAS and CB differ in magnitude but exhibit similar seasonal patterns. Both systems develop spring ciliate maxima in response to increases in phytoplankton biomass, however, species composition and the importance of ciliate trophic guilds in respective blooms are dissimilar. Dominance of spring blooms by distinct trophic guilds appears to reflect divergent levels of eutrophication and may translate into different ecological roles for microconsumers in the two regions.
Periodic outbreaks of large scyphomedusae, Chrysaora quinquecirrha in CB and Pelagia noctiluca in the NAS, may be related to nutrient enrichment and over fishing, but this has yet to be confirmed. Both species consume zooplankton and ichthyoplankton and are detrimental to fish stocks because they consume their food and prey on their young. Given their abundance in both systems, these gelatinous species may be important in nutrient recycling and in determining the structure of pelagic food webs. In addition, they have painful stings and negatively affect tourism.
1.2.3.4. Benthic Animals
Sessile macrobenthic animals exhibit varying degrees of stress, including death, in response to oxygen depletion. Their exact response depends on the duration and severity of the oxygen depletion and the pattern of exposure. Although seasonal bottom‐water oxygen depletion occurs in both systems, the spatial pattern and temporal extent differs. In CB, hypoxia occurs throughout the mesohaline reach for several weeks each summer, while bottom‐water hypoxia in the NAS occurs in different locations each year and for shorter periods than in CB. Thus, macrobenthic species that grow in those reaches of CB that experience seasonal hypoxia are r‐selected (species with high growth rates that exploit less‐crowded niches, and produce many offspring) enabling rapid recovery between events. Such recovery does not occur in areas of the NAS originally dominated by slow growing, long‐lived epibenthic species. In these locations small‐scale community extirpations begin to merge, thereby exerting a cumulative effect by reducing benthic biomass and species diversity over increasingly large areas.
Читать дальшеИнтервал:
Закладка:
Похожие книги на «Coastal Ecosystems in Transition»
Представляем Вашему вниманию похожие книги на «Coastal Ecosystems in Transition» списком для выбора. Мы отобрали схожую по названию и смыслу литературу в надежде предоставить читателям больше вариантов отыскать новые, интересные, ещё непрочитанные произведения.


Обсуждение, отзывы о книге «Coastal Ecosystems in Transition» и просто собственные мнения читателей. Оставьте ваши комментарии, напишите, что Вы думаете о произведении, его смысле или главных героях. Укажите что конкретно понравилось, а что нет, и почему Вы так считаете.