Coastal Ecosystems in Transition
Здесь есть возможность читать онлайн «Coastal Ecosystems in Transition» — ознакомительный отрывок электронной книги совершенно бесплатно, а после прочтения отрывка купить полную версию. В некоторых случаях можно слушать аудио, скачать через торрент в формате fb2 и присутствует краткое содержание. Жанр: unrecognised, на английском языке. Описание произведения, (предисловие) а так же отзывы посетителей доступны на портале библиотеки ЛибКат.
- Название:Coastal Ecosystems in Transition
- Автор:
- Жанр:
- Год:неизвестен
- ISBN:нет данных
- Рейтинг книги:3 / 5. Голосов: 1
-
Избранное:Добавить в избранное
- Отзывы:
-
Ваша оценка:
Coastal Ecosystems in Transition: краткое содержание, описание и аннотация
Предлагаем к чтению аннотацию, описание, краткое содержание или предисловие (зависит от того, что написал сам автор книги «Coastal Ecosystems in Transition»). Если вы не нашли необходимую информацию о книге — напишите в комментариях, мы постараемся отыскать её.
coastal ecosystems are responding to the pressures of human expansion
The Northern Adriatic Sea, a continental shelf ecosystem in the Northeast Mediterranean Sea, and the Chesapeake Bay, a major estuary of the mid-Atlantic coast of the United States, are semi-enclosed, river-dominated ecosystems with urbanized watersheds that support extensive industrial agriculture.
Coastal Ecosystems in Transition: A Comparative Analysis of the Northern Adriatic and Chesapeake Bay Volume highlights include:
Effects of nutrient enrichment and climate-driven changes on critical coastal habitats Patterns of stratification and circulation Food web dynamics from phytoplankton to fish Nutrient cycling, water quality, and harmful algal events Causes and consequences of interannual variability The American Geophysical Union promotes discovery in Earth and space science for the benefit of humanity. Its publications disseminate scientific knowledge and provide resources for researchers, students, and professionals.
Coastal Ecosystems in Transition — читать онлайн ознакомительный отрывок
Ниже представлен текст книги, разбитый по страницам. Система сохранения места последней прочитанной страницы, позволяет с удобством читать онлайн бесплатно книгу «Coastal Ecosystems in Transition», без необходимости каждый раз заново искать на чём Вы остановились. Поставьте закладку, и сможете в любой момент перейти на страницу, на которой закончили чтение.
Интервал:
Закладка:
River flows into CB, and associated inputs of nutrients and sediments, are monitored by the US Geological Survey (US Geological Survey, 2018). For the NAS, flow rates of Italian rivers are monitored the Hydrographic and Mareographic National Service of Italy (1917–1990s) and the Regional Environmental Protection Agencies (1990s to today). Nutrient data were obtained from the scientific literature, monitoring programs, and past projects (Cozzi & Giani, 2011; Cozzi et al., 2019). Data for the Istrian Rivers were provided by the Environmental Agency of the Republic of Slovenia, the Croatian Meteorological and Hydrological Service, and the European Environmental Agency.
The volume transports ( Q ) of major rivers flowing into CB and the NAS are similar and exhibited strong interannual variability during 1985–2015 ( Figure 2.1). On average, the Susquehanna accounts for 62% of riverine inputs of freshwater while the Po accounts for 69%. The highest transports in CB watershed occurred during the years 1996, 2004, and 2011 in association with major hurricanes and tropical storms ( Figure 2.1a). River flows to the NAS were characterized by a maximum during 2014 and lows during the drought period of 2003–2007 ( Figure 2.1b).
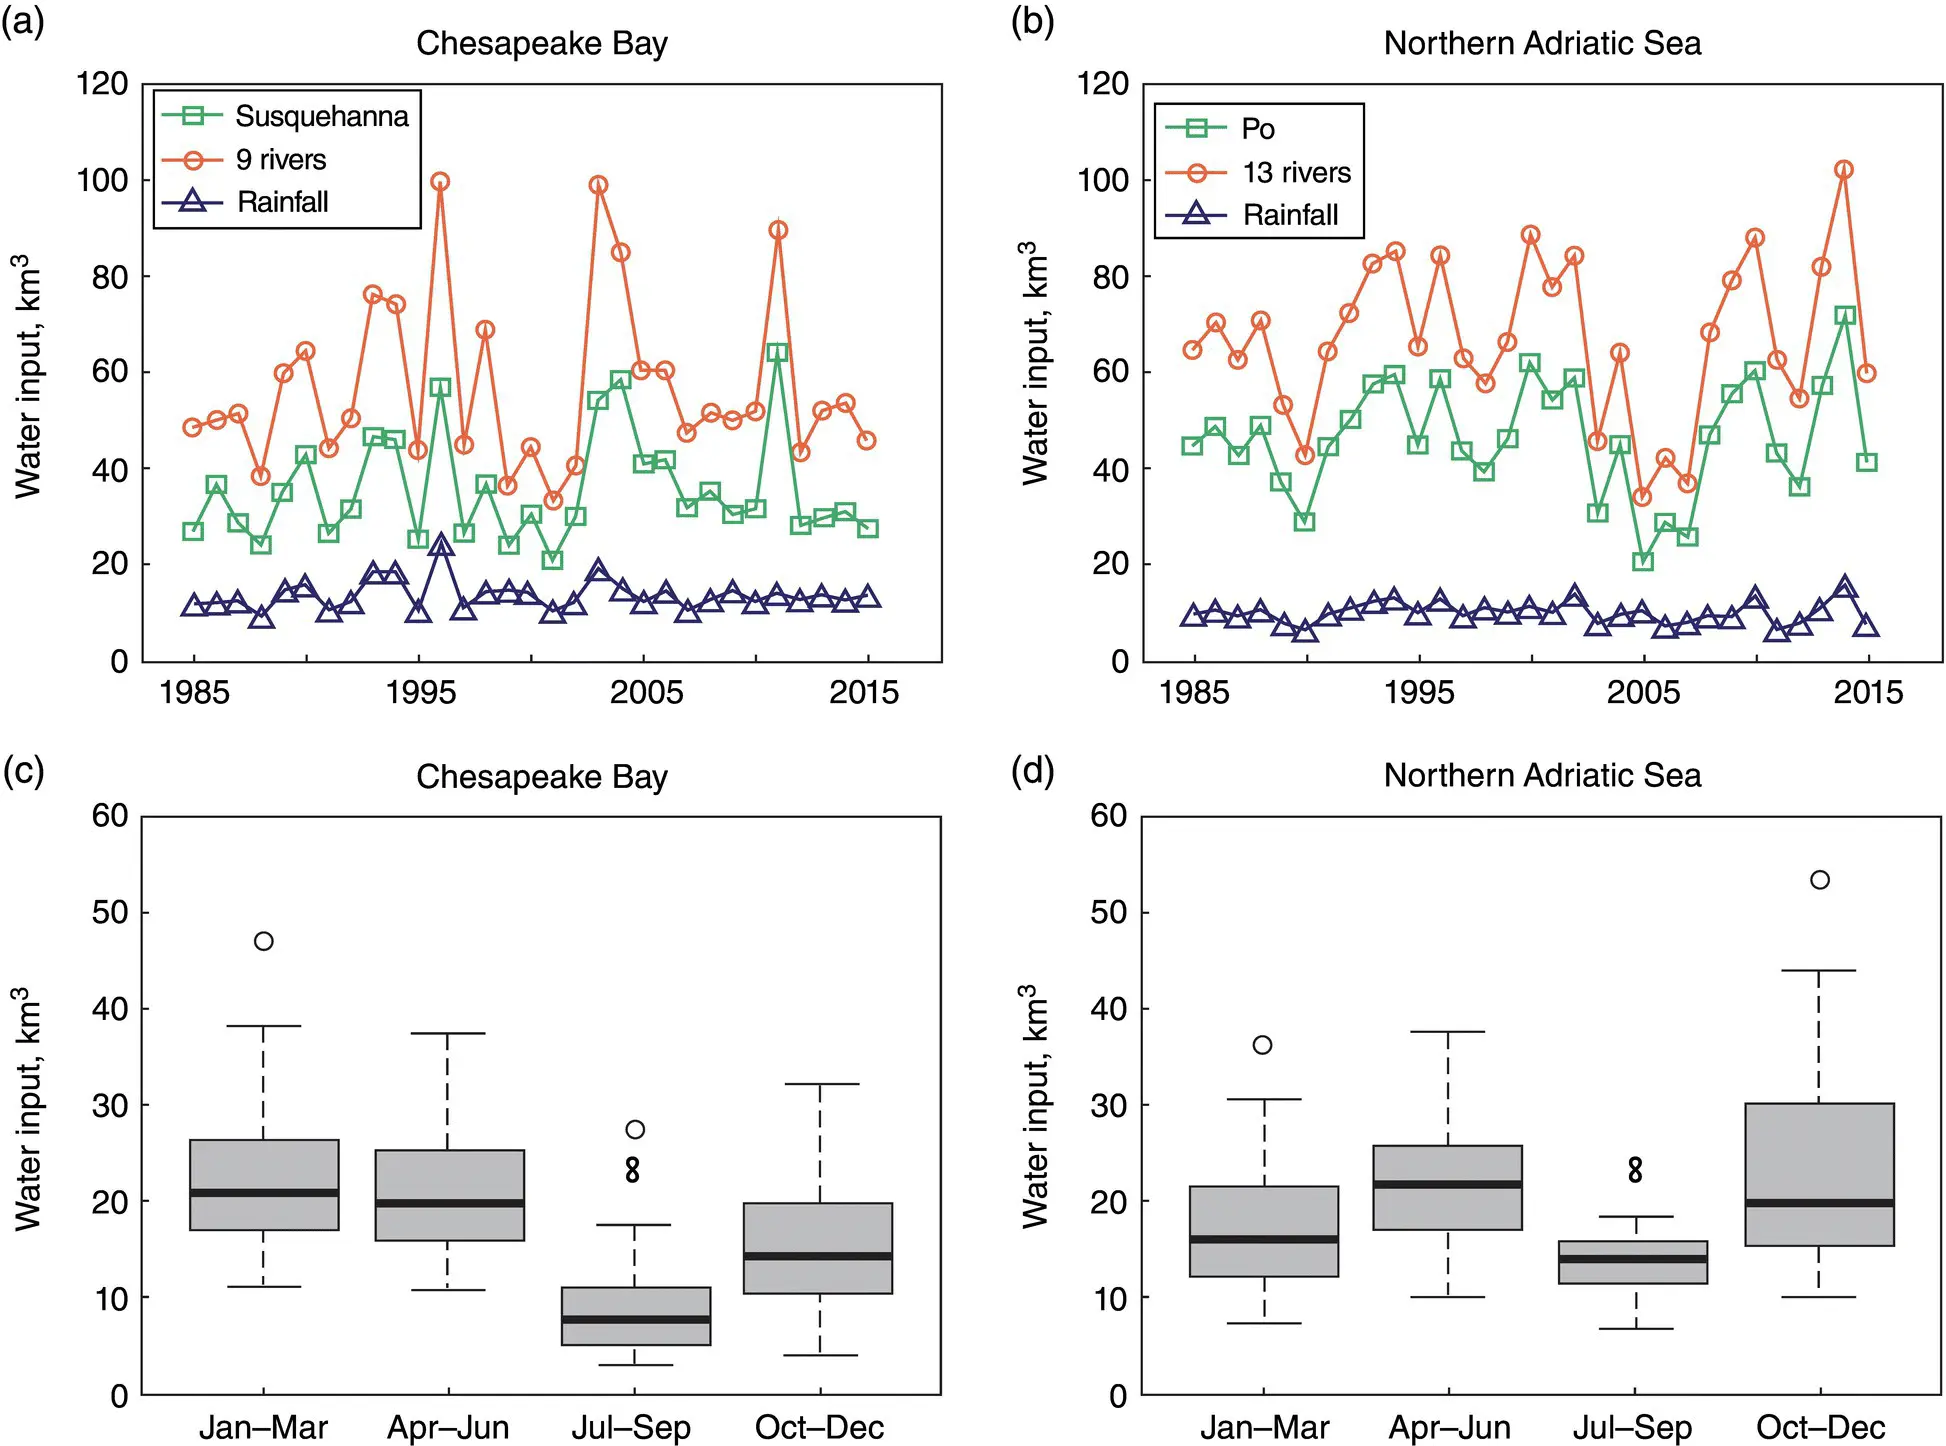
Figure 2.1 Time series of annual freshwater input to (a) Chesapeake Bay and (b) northern Adriatic Sea and boxplots of seasonal freshwater input to (c) Chesapeake Bay and (d) northern Adriatic Sea in the period of 1985–2015, including input from the largest river (Susquehanna and Po, respectively), input from all major tributaries, and direct wet precipitation.
The volume transports of major rivers flowing into CB and the NAS show strong seasonal variability. Seasonal peaks tended to occur during January–March and April–June in CB rivers ( Figure 2.1c). In comparison, seasonal peaks tended to occur during April–June and October–December in the NAS ( Figure 2.1d). Direct precipitation to the sea surface was estimated to account for 14–29% of seasonal freshwater input to CB and for 10–23% of the input to the NAS. For both systems, direct precipitation is more important in July–September relative to other months that have higher Q .
Freshwater inputs to CB and the NAS were further compared on a centennial scale using data from the Susquehanna and Po Rivers. During 1900–2015, the Susquehanna annual Q has an estimated Mann–Kendall (MK) trend slope of ‐0.0063 km 3year −1( p = 0.79). On a seasonal basis, Susquehanna Q had negative slopes in all four seasons, i.e., ‐0.010, ‐0.038, ‐0.095, and ‐0.025 km 3year −1in January–March, April–June, July–September, and October–December, respectively, with the latter three trends being statistically significant. During 1917–2015, the Po annual Q has an estimated trend slope of 0.016 km 3year −1( p = 0.86). On a seasonal basis, Po Q was estimated to have positive slopes in January–March (0.0050 km 3year −1) and October–December (0.0006 km 3year −1) and negative slopes in April–June (‐0.012 km 3year −1) and July–September (‐0.015 km 3year −1), with the July–September trend being statistically significant.
2.3. NUTRIENT INPUTS
2.3.1. Recent Status: 2004–2012
Median annual inputs of nutrients and sediment in 2004–2012 to CB and the NAS are summarized in Table 2.1. NO x(nitrate + nitrite) accounts for most of the TN load, whereas dissolved inorganic P (DIP) is a minor fraction of the TP load. Among the nine major tributaries, the Susquehanna contributes about 65% of TN and 46% of TP (Zhang et al., 2015). Relative to riverine inputs, inputs from direct precipitation to CB are small (7% of TN and 17% of TP).
Table 2.1 Median annual inputs of freshwater (Q, km 3) and nutrients (10 6kg year −1) to Chesapeake Bay (CB) and the northern Adriatic Sea (NAS) due to river runoff and precipitation (PPT) for the years 2004–2012
| Parameter | CB | NAS | ||||||
|---|---|---|---|---|---|---|---|---|
| Rivers | PPT | Total | Western rivers | Northern rivers | Eastern rivers | PPT | Total | |
| Q | 54.7 | 13.8 | 68.5 | 52.6 | 5.9 | 3.2 | 9.4 | 71.1 |
| TN | 84.9 | 5.7 | 90.6 | 145.0 | 16.0 | 6.3 | 13.6 | 180.9 |
| NO x | 56.7 | 2.5 | 59.2 | 101.0 | 12.0 | 4.3 | 5.0 | 122.3 |
| TP | 5.2 | 0.9 | 6.1 | 8.1 | 0.4 | 0.1 | 1.1 | 9.7 |
| DIP | 0.7 | 0.2 | 0.9 | 2.7 | 0.1 | 0.04 | 0.9 | 3.7 |
Note: TN, total nitrogen; NO x= nitrate + nitrite; TP, total phosphorus; DIP, dissolved inorganic phosphorus.
Compared with CB, riverine inputs of nutrients to the NAS are much higher ( Table 2.1), with riverine inputs of anthropogenic nutrients to the western NAS (dominated by the Po River) accounting for 80%, 83%, 84%, and 73% of annual inputs of TN, NO x, TP, and DIP, respectively. This reflects the higher population density in river watersheds of the western shore. Notably, nutrient inputs to the NAS are much lower than those to CB when normalized to the volume of the receiving water bodies (~1812 × 10 3kg N km −3year −1for CB vs. ~285 × 10 3kg N km −3year −1for the NAS). In addition, the TN/TP molar ratio for CB is much lower than for the NAS (33:1 vs. 41:1) while the NO x/DIP molar ratio for CB is much higher than for the NAS (141:1 vs. 72:1).
2.3.2. Seasonality (2004–2012)
For both CB and the NAS, nutrient and sediment loads show strong seasonal variability ( Figure 2.2). For CB, the annual input cycles of freshwater, TN, TP, and suspended sediment (SS) are typically unimodal with maxima during March–April and minima during July–August. This pattern has been reported for TN in all the major tributaries to CB (Zhang et al., 2015). For the NAS, the annual input cycles of freshwater, TN, and TP tend to be more bimodal with high inputs during April–June and October–December and low inputs during January–March and July–September.
2.3.3. Long‐Term Trends (1985–2015)
Interannual variations in Susquehanna annual loads of TN and NO xhave negative MK slopes while TP and SS have positive slopes ( Figure 2.3). Although these slopes are not statistically significant, their directions are consistent with results of flow‐normalized loads (Zhang et al., 2015) that account for interannual variability in river flow (Hirsch et al., 2010). Declines in TN and NO xwere partially due to upgraded wastewater treatment (Boynton et al., 2008) and decreases in atmospheric deposition due to the Clean Air Act (Eshleman et al., 2013; Linker, Dennis, et al., 2013). By contrast, TP and SS loads have increased since the late 1990s, likely due to declining trapping efficiency of the Conowingo Dam in the lower Susquehanna (Hirsch, 2012; Langland, 2015; Zhang, Ball, et al., 2016; Zhang et al., 2013).
Interannual variations in the Po River annual load of TN had a positive MK slope while loads of NO x, TP, DIP, and SS had negative slopes ( Figure 2.3). The only statistically significant trend for Po is with DIP, which shows a long‐term reduction after the peak in the 1980s. This pattern can be attributed to a reduction of P content in fertilizers and detergents, as well as improved management of wastewaters (Cozzi & Giani, 2011; Viaroli et al., 2018). By contrast, N loads have been driven by interannual oscillations from persistent anthropogenic N emission in the watershed and by interannual changes in river flow, particularly during the extreme drought of 2003–2007 (Cozzi et al., 2019). Current transport of SS by the Po is high compared to river flow, due to large SS contributions by the Apennine tributaries and the absence of dams in the lower river (Tesi et al., 2013). Transport of SS to the NAS is critical for the maintenance of delta and along‐shore habitats, as well as for sedimentation processes in the western Adriatic Sea (Frignani et al., 2005). Despite SS transport decreases during the previous century, the present estimates suggest that SS loads have not changed significantly since the 1980s.
Читать дальшеИнтервал:
Закладка:
Похожие книги на «Coastal Ecosystems in Transition»
Представляем Вашему вниманию похожие книги на «Coastal Ecosystems in Transition» списком для выбора. Мы отобрали схожую по названию и смыслу литературу в надежде предоставить читателям больше вариантов отыскать новые, интересные, ещё непрочитанные произведения.


Обсуждение, отзывы о книге «Coastal Ecosystems in Transition» и просто собственные мнения читателей. Оставьте ваши комментарии, напишите, что Вы думаете о произведении, его смысле или главных героях. Укажите что конкретно понравилось, а что нет, и почему Вы так считаете.