Coastal Ecosystems in Transition
Здесь есть возможность читать онлайн «Coastal Ecosystems in Transition» — ознакомительный отрывок электронной книги совершенно бесплатно, а после прочтения отрывка купить полную версию. В некоторых случаях можно слушать аудио, скачать через торрент в формате fb2 и присутствует краткое содержание. Жанр: unrecognised, на английском языке. Описание произведения, (предисловие) а так же отзывы посетителей доступны на портале библиотеки ЛибКат.
- Название:Coastal Ecosystems in Transition
- Автор:
- Жанр:
- Год:неизвестен
- ISBN:нет данных
- Рейтинг книги:3 / 5. Голосов: 1
-
Избранное:Добавить в избранное
- Отзывы:
-
Ваша оценка:
Coastal Ecosystems in Transition: краткое содержание, описание и аннотация
Предлагаем к чтению аннотацию, описание, краткое содержание или предисловие (зависит от того, что написал сам автор книги «Coastal Ecosystems in Transition»). Если вы не нашли необходимую информацию о книге — напишите в комментариях, мы постараемся отыскать её.
coastal ecosystems are responding to the pressures of human expansion
The Northern Adriatic Sea, a continental shelf ecosystem in the Northeast Mediterranean Sea, and the Chesapeake Bay, a major estuary of the mid-Atlantic coast of the United States, are semi-enclosed, river-dominated ecosystems with urbanized watersheds that support extensive industrial agriculture.
Coastal Ecosystems in Transition: A Comparative Analysis of the Northern Adriatic and Chesapeake Bay Volume highlights include:
Effects of nutrient enrichment and climate-driven changes on critical coastal habitats Patterns of stratification and circulation Food web dynamics from phytoplankton to fish Nutrient cycling, water quality, and harmful algal events Causes and consequences of interannual variability The American Geophysical Union promotes discovery in Earth and space science for the benefit of humanity. Its publications disseminate scientific knowledge and provide resources for researchers, students, and professionals.
Coastal Ecosystems in Transition — читать онлайн ознакомительный отрывок
Ниже представлен текст книги, разбитый по страницам. Система сохранения места последней прочитанной страницы, позволяет с удобством читать онлайн бесплатно книгу «Coastal Ecosystems in Transition», без необходимости каждый раз заново искать на чём Вы остановились. Поставьте закладку, и сможете в любой момент перейти на страницу, на которой закончили чтение.
Интервал:
Закладка:
2.4. CONTROLS OF NUTRIENT EXPORT
2.4.1. Nutrient Sources
Watershed export of nutrients is complex due to heterogeneities in their sources, fates, and transports. In terms of sources, agriculture nonpoint sources, atmospheric deposition, urban (storm water) sources, as well as point sources (wastewater treatment plants) account for most inputs to CB and the NAS watersheds (Ator et al., 2011; Palmeri et al., 2005; Salvetti et al., 2006; Viaroli et al., 2018; Volf et al., 2013). Globally, there is a significant linear correlation between net anthropogenic N supplies to coastal watersheds and total riverine nitrogen export to the coastal ocean (Boyer & Howarth, 2008). However, it should be noted that the major sources and their relative contributions can vary significantly both spatially (as a function of watershed characteristics such as land use, climate, and geology) and temporally (as a function of watershed management, urbanization) (Ator et al., 2011; Carpenter et al., 1998).
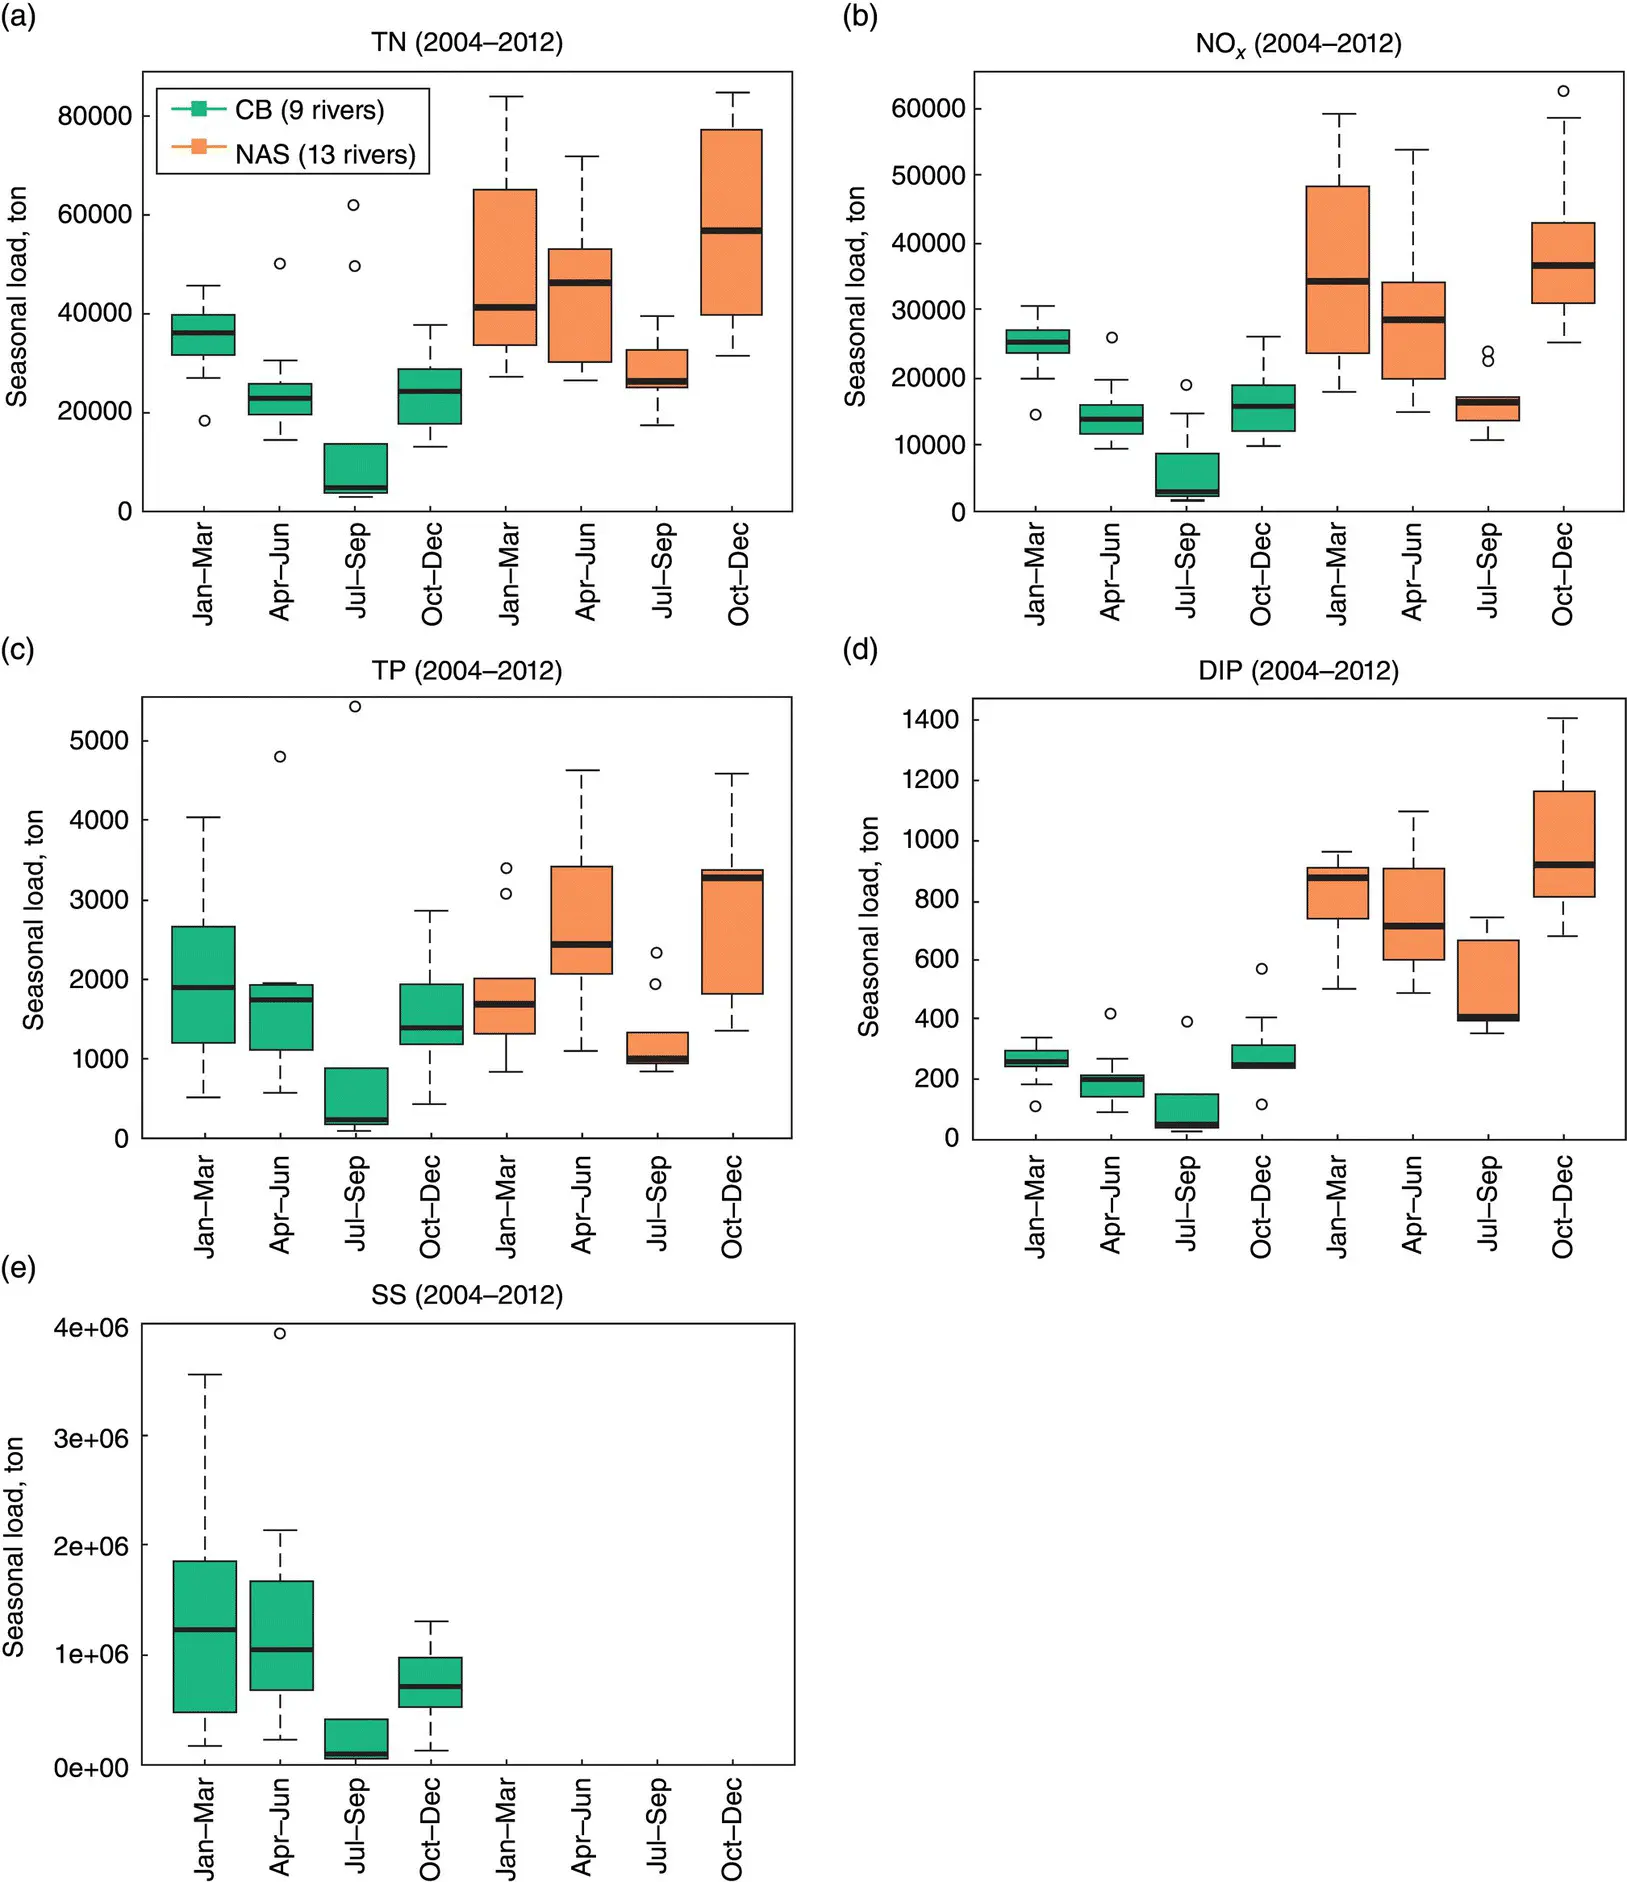
Figure 2.2 Boxplots showing seasonal loads of (a) total nitrogen (TN), (b) nitrate + nitrite (NO x), (c) total phosphorus (TP), (d) dissolved inorganic phosphorus (DIP), and (e) suspended sediment (SS) to Chesapeake Bay (four boxes on the left) and the northern Adriatic Sea (four boxes on the right) from tributaries with available data (9 and 13 tributaries, respectively) in 2004–2012.
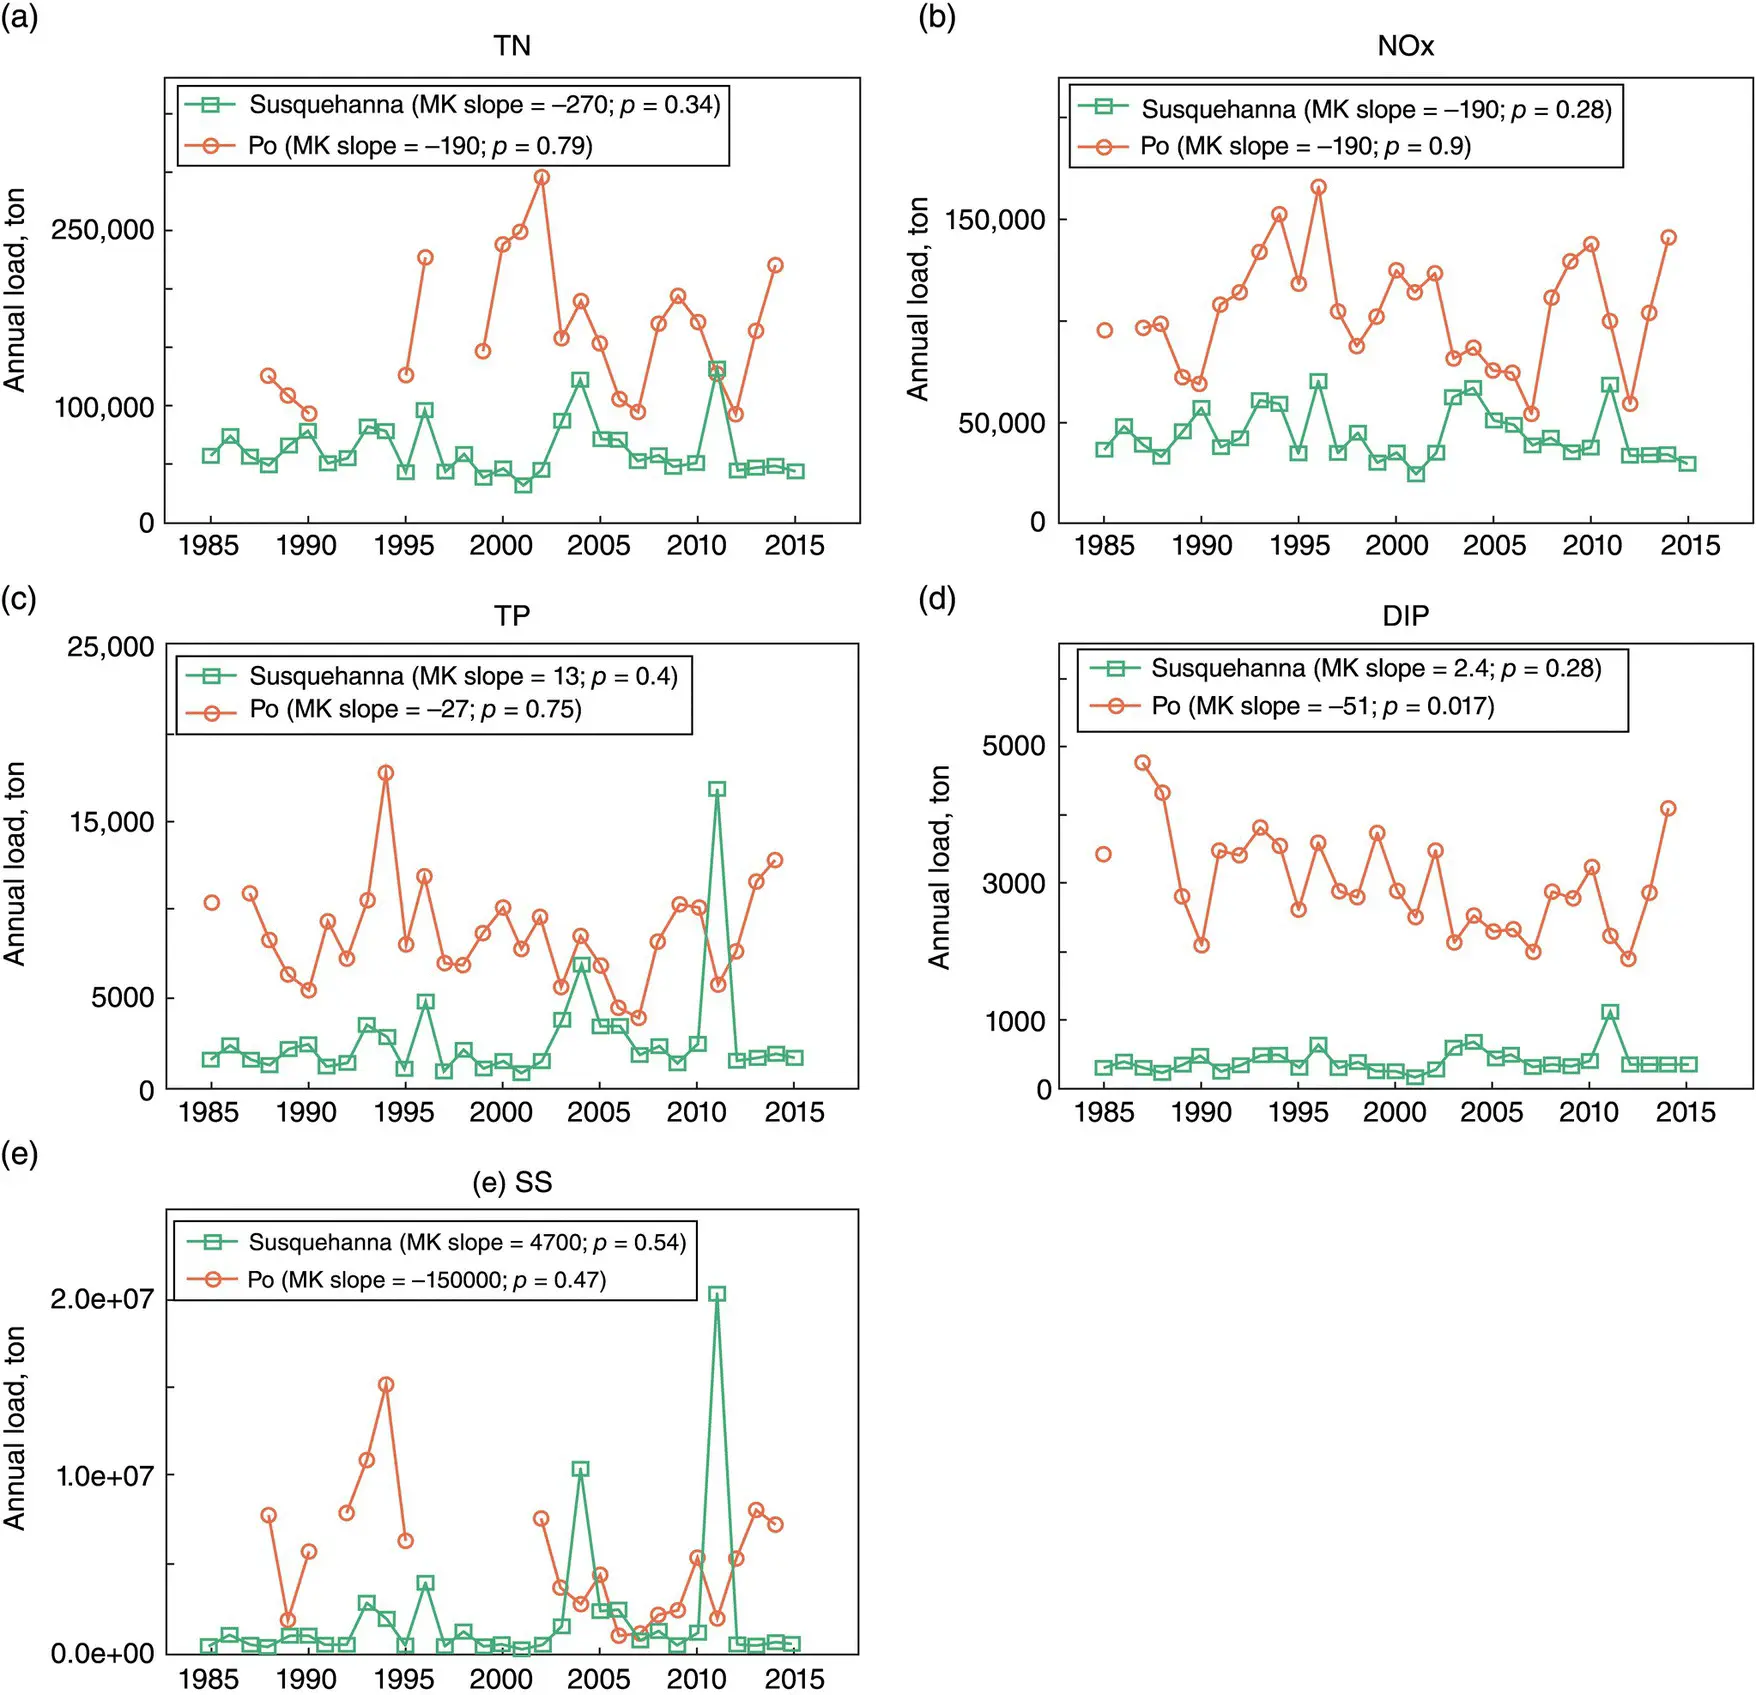
Figure 2.3 Time series of annual loads of (a) total nitrogen (TN), (b) nitrate + nitrite (NO x), (c) total phosphorus (TP), (d) dissolved inorganic phosphorus (DIP), and (e) suspended sediment (SS) to Chesapeake Bay and the northern Adriatic Sea from their largest tributaries (i.e., Susquehanna and Po, respectively) in 1985–2015. Mann‐Kendall (MK) trend slope and significance ( p ) values are shown in legend.
For the CB watershed, riverine export of TN was dominated by agriculture nonpoint sources (fertilizer and manure 54%), followed by contributions from atmospheric deposition (17%), point sources (16%), and urban sources (12%). Riverine export of TP was dominated by agriculture nonpoint sources (43%), followed by point sources (32%) and urban sources (11%) (Ator et al., 2011). Typically, nutrients accumulate in watersheds during dry periods of low flows and are transported to receiving waters via groundwater discharge and surface water runoff during wet periods and storm events (Shields et al., 2008; Tesi et al., 2013). Groundwater can represent a major fraction of riverine load (especially N). Bachman et al. (1998) estimated that base flow (a proxy of groundwater input) accounted for 17–80% (median 48%) of the TN load at 36 CB monitoring sites. In addition, riverine export can be strongly modulated by reservoirs. For example, Conowingo Reservoir and two others in the lower Susquehanna River historically trapped about 2%, 45%, and 70% of annual N, P, and SS load, respectively (Langland & Hainly, 1997).
Riverine inputs of TN to the NAS were also dominated by agriculture nonpoint sources (40%) followed by point and urban sources (27%), and groundwater (29%). The TP load mainly originated from point sources and urban sources (43%) and agriculture nonpoint sources (36%) (Volf et al., 2013). For the Po watershed, TN load comes from point sources (40%), nonpoint sources (20%), and groundwater and springs (40%), whereas TP loads come from point sources (80%) and nonpoint sources (20%) (Salvetti et al., 2006).
2.4.2. Controlling Factors
In the CB watershed, several controlling factors have been identified for nutrient export in the Susquehanna River (Zhang, Ball, et al., 2016). First, river flow dominates the interannual variability of constituent export. Second, land‐use patterns strongly affect the relative contribution of the subwatersheds. Specifically, long‐term median yields of N, P, and SS all correlate positively with the fraction of the watershed that is not forested. Third, riverine loads from different Susquehanna subwatersheds have generally declined due to reductions in source input over the same period. Finally, dams and reservoirs can strongly modulate the storage and release of particulate constituents and the extent of modulation has varied considerably over time as reservoirs fill. Two decades ago, the Conowingo Reservoir and two others in the lower Susquehanna River trapped about 2%, 45%, and 70% of annual N, P, and SS load, respectively (Langland & Hainly, 1997). Currently, the reservoir system is no longer an effective trap of these constituents (Hirsch, 2012; Langland, 2015; Zhang et al., 2013; Zhang, Hirsch, et al., 2016).
In the NAS watershed, the annual export of nutrient and sediment is directly linked to river flow and can be estimated using Po River loads as a reference (Cozzi & Giani, 2011). However, the short‐term dynamics of riverine loads are complicated during freshets by the effects of flow on the erosion, groundwater inputs, dilution, and biological processes in the river environment (Marchina et al., 2015; Tesi et al., 2013). The N and P loads in the marine environment have long‐term trends consistent with watershed inputs from industrial activities, agriculture, livestock, urban settlements, and atmospheric deposition; dynamics of their delivery are also modulated by the variable retention of these elements in soils and aquifers (Cozzi et al., 2019; Palmeri et al., 2005; Salvetti et al., 2006; Viaroli et al., 2018). In general, retention mechanisms differ considerably between N and P—sedimentation may be the major retention mechanism for particulate P during overland flow conditions (Cirmo & McDonnell, 1997; Hoffmann et al., 2009), whereas sorption/desorption reactions and denitrification are more important for P and N, respectively, during subsurface flow conditions (House, 2003; Withers & Jarvie, 2008).
2.4.3. Watershed Management
For CB, coordinated efforts have been implemented to reduce pollutant inputs since the first Chesapeake Bay Agreement was signed in 1983. Here we provide a brief overview of historical changes in management and practices associated with point, agricultural, and stormwater sources in the Susquehanna River (Zhang et al., 2013). For point sources, the more important historical controls were the P ban in detergents (Litke, 1999) and the adoption of increasingly effective nutrient removal technologies at wastewater treatment plants (Chesapeake Executive Council, 1988). For agriculture nonpoint sources, many strategies have focused on controlling fertilizer and manure applications, including regulations on storage and usage of animal manure and regulations on concentrated animal operations and feeding operations (New York State Department of Environmental Conservation, 2007; Pennsylvania Department of Environmental Protection, 2004; US Department of Agriculture and US Environmental Protection Agency, 1999). For stormwater sources, the USEPA initiated the National Pollutant Discharge Elimination System Phase I regulations in 1990 for Municipalities with Separate Storm Sewer Systems (MS4s) serving populations of 100,000 or more (US Environmental Protection Agency, 2000) and expanded the program in 1999 to include smaller MS4s (US Environmental Protection Agency, 2000). States also took actions to promulgate regulations on stormwater discharges in the late 1990s to early 2000s (New York State Department of Environmental Conservation, 2007; Pennsylvania Department of Environmental Protection, 2004).
Читать дальшеИнтервал:
Закладка:
Похожие книги на «Coastal Ecosystems in Transition»
Представляем Вашему вниманию похожие книги на «Coastal Ecosystems in Transition» списком для выбора. Мы отобрали схожую по названию и смыслу литературу в надежде предоставить читателям больше вариантов отыскать новые, интересные, ещё непрочитанные произведения.


Обсуждение, отзывы о книге «Coastal Ecosystems in Transition» и просто собственные мнения читателей. Оставьте ваши комментарии, напишите, что Вы думаете о произведении, его смысле или главных героях. Укажите что конкретно понравилось, а что нет, и почему Вы так считаете.