DNA- and RNA-Based Computing Systems
Здесь есть возможность читать онлайн «DNA- and RNA-Based Computing Systems» — ознакомительный отрывок электронной книги совершенно бесплатно, а после прочтения отрывка купить полную версию. В некоторых случаях можно слушать аудио, скачать через торрент в формате fb2 и присутствует краткое содержание. Жанр: unrecognised, на английском языке. Описание произведения, (предисловие) а так же отзывы посетителей доступны на портале библиотеки ЛибКат.
- Название:DNA- and RNA-Based Computing Systems
- Автор:
- Жанр:
- Год:неизвестен
- ISBN:нет данных
- Рейтинг книги:4 / 5. Голосов: 1
-
Избранное:Добавить в избранное
- Отзывы:
-
Ваша оценка:
DNA- and RNA-Based Computing Systems: краткое содержание, описание и аннотация
Предлагаем к чтению аннотацию, описание, краткое содержание или предисловие (зависит от того, что написал сам автор книги «DNA- and RNA-Based Computing Systems»). Если вы не нашли необходимую информацию о книге — напишите в комментариях, мы постараемся отыскать её.
by the same editor, the book is an authoritative reference for those who hope to better understand DNA- and RNA-based logic gates, multi-component logic networks, combinatorial calculators, and related computational systems that have recently been developed for use in biocomputing devices.
DNA- and RNA-Based Computing Systems A thorough introduction to the fields of DNA and RNA computing, including DNA/enzyme circuits A description of DNA logic gates, switches and circuits, and how to program them An introduction to photonic logic using DNA and RNA The development and applications of DNA computing for use in databases and robotics Perfect for biochemists, biotechnologists, materials scientists, and bioengineers,
also belongs on the bookshelves of computer technologists and electrical engineers who seek to improve their understanding of biomolecular information processing. Senior undergraduate students and graduate students in biochemistry, materials science, and computer science will also benefit from this book.
DNA- and RNA-Based Computing Systems — читать онлайн ознакомительный отрывок
Ниже представлен текст книги, разбитый по страницам. Система сохранения места последней прочитанной страницы, позволяет с удобством читать онлайн бесплатно книгу «DNA- and RNA-Based Computing Systems», без необходимости каждый раз заново искать на чём Вы остановились. Поставьте закладку, и сможете в любой момент перейти на страницу, на которой закончили чтение.
Интервал:
Закладка:
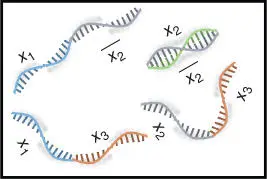
Figure 2.5Illustration of four literal strings for the DNA hairpin formation‐based computation.
2.2.5 Ouyang's Model
Ouyang et al. [11] solved a maximal clique problem using DNA computing method. A maximal clique is the largest subset in the graph in which each vertex is connected to every other vertex in the subset. In maximal clique problem, the maximum size of the clique in terms of the vertices has to be evaluated. For example ( Figure 2.6a), the graph has five vertices, and eight edges where the vertices (5, 4, 2, 1) is the largest clique; thus the maximum size of the clique is four. Ouyang et al. [11] solved the maximal clique problem using DNA computing as follows.
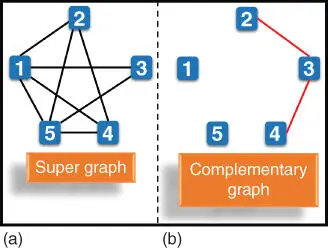
Figure 2.6(a) The five‐node graph and (b) its complementary graph used to solve the maximal clique problem.
First, all possible cliques in the graph of N vertices are represented by an N ‐digit binary string. In the clique, if the vertex is present, then it is represented by “1,” and if the vertex is absent, then it is represented by “0.” For the case of 5‐vertex graph (shown in Figure 2.6a), a clique involving {5, 4, 2} vertices is represented by a binary string as {11010}. Initially, all possible combinations of this N ‐digit binary number are generated. Some of the vertices in the graph are not connected by the edges. A graph of such unconnected vertices is referred to as the complementary graph (see Figure 2.6b). In the next step, the combinations comprising the edges present in the complementary graph are removed. For the given illustrative example ( Figure 2.6b), the combinations with {cc11c} and {c11cc} are removed from the data pool (c ɛ {0, 1}). Lastly, find out the binary number having the largest number of “1,” which represents the size of the maximal clique. This procedure is performed using the DNA sequences as follows.
Each bit in the above binary string corresponds to a vertex and is represented as a DNA sequence having three parts. In this, the second part corresponds to the vertex number, whereas the first and the third part correspond to the position number. Further, these vertices have to be connected in sequential order (e.g. V 1– V N) as represented in the binary string. In order to have such connection, the value “0” for the first vertex is represented as P 1V 1 0P 2, whereas the value “1” is represented by P 1V 1 1P 2. Since the next vertex V 2has to be connected to V 1, its “0” value is represented by the complementary sequence  , whereas its value “1” is represented by the sequence
  . Similarly, the next vertex V 3will be connected to V 2by P 3V 3 0P 4and P 3V 3 1P 4for “0” and “1” values. Thus, all odd‐numbered vertices are represented by P iV i 0P i+1and P iV i 1P i+1for “0” and “1” values, whereas those for even‐numbered vertices are represented by
  and
and  , respectively. Further, all sequences with
  have 10 nucleotides representing the second part, whereas these are absent in
  . The ssDNA sequences corresponding to each bit combine in a sequential manner to form a dsDNA representing all combination of 0 or 1 for each vertex. Initially, all the sequences starting with P 1and ending with P Nare amplified using PCR. The complementary graph is removed from the data pool by treating the DNA solutions using the restriction enzyme repeatedly for each edge present in the corresponding graph. For each edge, the DNA solution is divided into two equal parts in two tubes, and the restriction enzymes corresponding to the constituting vertices are added in the respective tubes. After restriction enzyme digestion, solutions of both tubes are added, and the process is repeated for all the edges of the corresponding graph. After this, a PCR is performed with starting P 1and ending P N. The amplified solutions are then analyzed using gel electrophoresis to obtain the maximal clique for the given supergraph. On the gel electrophoresis, the largest clique is corresponding to the shortest DNA strands. This is primarily because all the sequences comprising maximum
  will lead to the maximum “1”s in the binary string and will have the shortest length in base pairs. Such strands are analyzed by cloning and sequencing to obtain the maximal clique. For the given illustrative example (Figure 1.12b), {cc11c} and {c11cc} sequences will be removed. Therefore, the sequences that will lead to the maximal clique will be {11011}. From these, the maximal size of the clique for the given illustrative example is four, which corresponds to the clique V 1–V 2–V 4–V 5.
2.2.6 Chao's Model
Chao et al. [13] developed a single‐molecule “DNA navigator” to solve a maze (tree graph) of 10 vertices with three junctions. In this, the desired path is explored out of all possible paths of the maze present on an origami that is used as a substrate. On this origami, some sites are specifically used for the binding of the vertices of the tree graph. This helps in the propagation of the path on the origami.
The DNA used for the process is very specific in size and design. The designing of DNA is described next. Hairpin DNA Y is attached to the origami and has a typical sequence layout of the structure  , as shown in Figure 2.7. Another type of DNA used is hairpin DNA Z, which is present freely in the solution. Its structure is like
 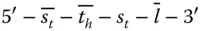 . Additionally, an initiator DNA that has a sequence
  is used to start the process. This initiator DNA binds to the entry vertex. Similarly, an exit DNA is present, which does not have a loop to form a hairpin.
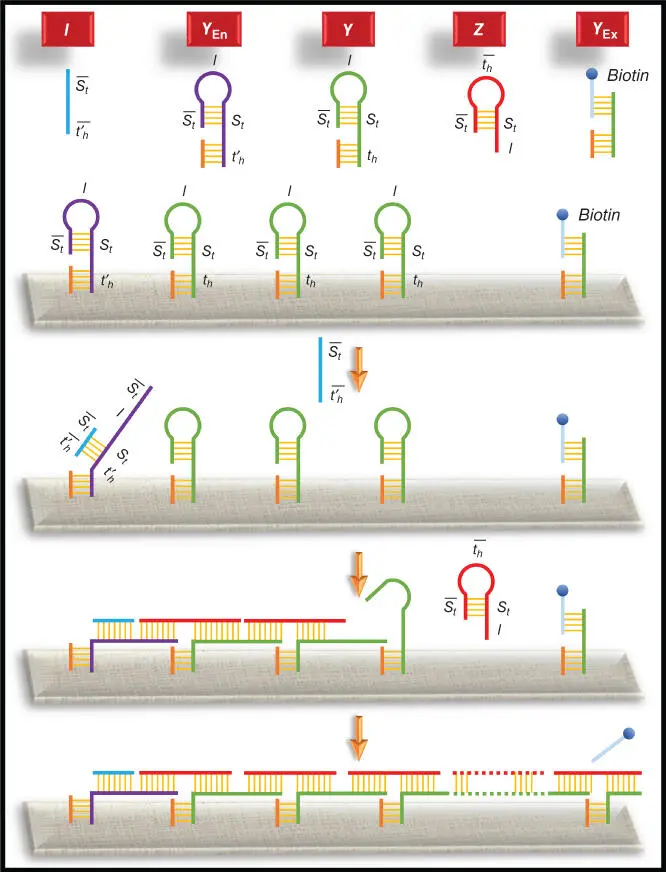
Figure 2.7Chao's single‐molecule DNA navigator [13] for solving the maze.
After the binding of the initiator, a hairpin loop of the DNA Y opens to make it free to bind to DNA Z and vice versa as both have complementary sites for free form of each other. This type of hybridization continues until it reaches the exit DNA. This hybridization chain also produces those paths that are not the solution to the maze. The exit DNA corresponding to an end vertex of the maze is biotin labeled. If the path is correct, then this biotin‐labeled DNA is free from the exit vertex; otherwise, biotin remains attached to the DNA corresponding to the exit vertex. All the biotin‐labeled sequences are then removed from the solution by streptavidin magnetic beads. The correct path sequence remained in the solution as it is not attached to the biotin. This solution is then analyzed by AFM for identifying the final path.
Читать дальшеИнтервал:
Закладка:
Похожие книги на «DNA- and RNA-Based Computing Systems»
Представляем Вашему вниманию похожие книги на «DNA- and RNA-Based Computing Systems» списком для выбора. Мы отобрали схожую по названию и смыслу литературу в надежде предоставить читателям больше вариантов отыскать новые, интересные, ещё непрочитанные произведения.


Обсуждение, отзывы о книге «DNA- and RNA-Based Computing Systems» и просто собственные мнения читателей. Оставьте ваши комментарии, напишите, что Вы думаете о произведении, его смысле или главных героях. Укажите что конкретно понравилось, а что нет, и почему Вы так считаете.