Jörg Flock - X-Ray Fluorescence Spectroscopy for Laboratory Applications
Здесь есть возможность читать онлайн «Jörg Flock - X-Ray Fluorescence Spectroscopy for Laboratory Applications» — ознакомительный отрывок электронной книги совершенно бесплатно, а после прочтения отрывка купить полную версию. В некоторых случаях можно слушать аудио, скачать через торрент в формате fb2 и присутствует краткое содержание. Жанр: unrecognised, на английском языке. Описание произведения, (предисловие) а так же отзывы посетителей доступны на портале библиотеки ЛибКат.
- Название:X-Ray Fluorescence Spectroscopy for Laboratory Applications
- Автор:
- Жанр:
- Год:неизвестен
- ISBN:нет данных
- Рейтинг книги:5 / 5. Голосов: 1
-
Избранное:Добавить в избранное
- Отзывы:
-
Ваша оценка:
X-Ray Fluorescence Spectroscopy for Laboratory Applications: краткое содержание, описание и аннотация
Предлагаем к чтению аннотацию, описание, краткое содержание или предисловие (зависит от того, что написал сам автор книги «X-Ray Fluorescence Spectroscopy for Laboratory Applications»). Если вы не нашли необходимую информацию о книге — напишите в комментариях, мы постараемся отыскать её.
on using X-ray fluorescence for laboratory applications
This book focuses on the practical aspects of X-ray fluorescence (XRF) spectroscopy and discusses the requirements for a successful sample analysis, such as sample preparation, measurement techniques and calibration, as well as the quality of the analysis results.
X-Ray Fluorescence Spectroscopy for Laboratory Applications
X
An important resource for the analytical chemist, providing concrete guidelines and support for everyday analyses Focuses on daily laboratory work with commercially available devices Offers a unique compilation of knowledge and best practices from equipment manufacturers and users Covers the entire work process: sample preparation, the actual measurement, data processing, assessment of uncertainty, and accuracy of the obtained results
appeals to analytical chemists, analytical laboratories, materials scientists, environmental chemists, chemical engineers, biotechnologists, and pharma engineers.
X-Ray Fluorescence Spectroscopy for Laboratory Applications — читать онлайн ознакомительный отрывок
Ниже представлен текст книги, разбитый по страницам. Система сохранения места последней прочитанной страницы, позволяет с удобством читать онлайн бесплатно книгу «X-Ray Fluorescence Spectroscopy for Laboratory Applications», без необходимости каждый раз заново искать на чём Вы остановились. Поставьте закладку, и сможете в любой момент перейти на страницу, на которой закончили чтение.
Интервал:
Закладка:
The intensity of the elastic scattered radiation depends on the direction of the scattered radiation. The scattering intensity of non-polarized radiation on a sphere with the diameter R and the scattering object in its center can be described by the following formula, Θ being the scatter angle:
(2.7) 
As a result, the scatter intensity has a maximum in the forward and backward directions, while it is reduced perpendicular to the direction of irradiation.
Inelastic scattering means a loss of energy of the scattered radiation compared to the original incident radiation. The energy is transferred to the scattering particle, most often an electron, which is then emitted as photoelectron. Because the conservation laws for both energy and momentum apply, the energy loss Δ E depends on the scatter angle Θ and on the energy E of the scattered radiation. For scattering on an electron this dependence is described by the following formula:
(2.8) 
2.2.5 Detection of X-ray Spectra
The radiation emitted by a sample is detected by an X-ray spectrometer. The spectrometer separates energetically different beam components and determines their intensity within narrow energy ranges; they can be, for example, individual element peaks as well as background areas with narrow energy ranges of a few electronvolts. In principle, two instrument types for spectrometry are in use where the dispersion takes place by different means:
In the case of wavelength-dispersive spectrometers (WDSs – see Section 4.3.2), the separation of the radiation components takes place via a dispersive element, for example, a crystal, or, at low energies, by special multilayer structures, on which the fluorescence radiation of the sample is diffracted. The “reflection” of individual energies takes place only at defined diffraction angles, following Bragg's law, see Eq. (4.1).
In the case of energy-dispersive spectrometers (EDSs – see Section 4.3.1.3), the dispersion is performed directly in the detector and its associated electronics. This generates an energy-dependent signal from each individual absorbed X-ray photon. By means of pulse-height analysis, the probability distribution of the photon energies absorbed in the detector can be generated, creating an image of the emitted spectrum.
For analytical purposes, element identification, i.e. qualitative analysis, is possible due to the element dependence of the energies of the characteristic radiation (see Eq. (2.4)).
The intensity of this characteristic radiation depends on the number of atoms in the analyzed material, i.e. on their contents w . In a first approximation, therefore, the mass fraction w = ε · I , where ε is the element-dependent sensitivity, and I is the measured fluorescence intensity of the element under consideration. Unfortunately, the conditions are more complex than this, as all other elements in the sample influence through absorption and secondary excitation the measured fluorescence intensities. For a quantitative analysis this matrix influence has to be considered. It leads to complex corrections of the above linear dependency (see Section 5.5).
2.3 The Development of X-ray Spectrometry
The period from the beginnings of early X-ray spectrometry to today's powerful instrument technology has been long. The first stage was characterized by the development of sufficiently powerful instrument components and the development of basic mathematical models for matrix interaction. In the next step, the use of computing technology for data preparation as well as for instrument control was an important step for the establishment of the method for automated industrial use. Finally, the application areas of the method have been significantly expanded in the last 20 years by the availability of various X-ray optic elements as well as more powerful detectors.
The development of X-ray fluorescence is briefly described by Niese (2007). The foundations for the use of X-ray spectrometry for element analysis were laid out by the discoveries of Moseley and Laue, and by using X-ray radiation for the screening of the human body for medical purposes. Experience was gained in making components such as X-ray tubes for the emission and X-ray films for the detection of the radiation. These were the preconditions for the initial use of X-ray spectrometry for element analysis.
The first attempts for an element analysis with X-rays, still utilizing electron excitation, were carried out by v.Hevesy for determining the content of tantalum (Hevesy et al. 1930; Hevesy and Böhm 1927). The excitation of the sample with X-rays was first published by Glocker and Schreiber (1928) but also used by v.Hevesy. Nevertheless, the transition from simple laboratory designs to the first serial production of instruments required a few more years. Siemens and Philips built the first commercial instruments in the early 1950s. Taking advantage of the experiences gained during the initial designs, these instruments already showed an acceptable ease of operation and sufficient radiation protection. The successful and ever-widening use of X-ray fluorescence spectrometry in laboratory analysis began with these instruments. Significant progress has been made in Europe, in particular by companies such as Siemens, Philips, and Bausch & Lomb. Through successive development steps, such as the expansion of the detectable element range by the use of different crystals, the improvement of analytical accuracy by the increased performance of the X-ray tubes, the improvement of precision by more powerful evaluation models or by simplifying the sample management by means of sample carriers or magazines, improvements in the analytical performance and in range the applications were achieved. A typical instrument from the beginnings of commercial X-ray spectrometry is shown in Figure 2.9, the PW 1540 from Philips.
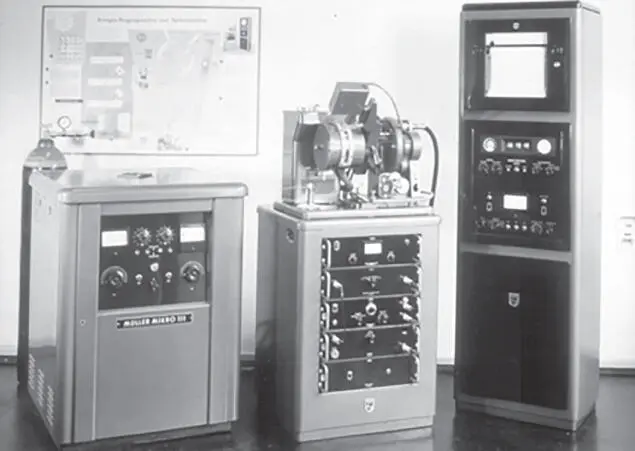
Figure 2.9 PW 1540 from Philips.
Significant progress could be made by the introduction of electronic data processing, which began in the 1970s. At the beginning, it was mainly used for complex data processing, and later also for the control of instrument functions. As a result, XRF became much more powerful, not only regarding the analytical performance but also in regard to the ease of use, the sample throughput, and the ability to automate the analytics. This was of extraordinary importance for the acceptance of X-ray spectrometry as an analytical method and its wide use in quality control in industrial production. A further important step was the integration of automated sample preparation, measurement, and instrument monitoring for the improvement of analytical quality and the reduction of the subjective influence of human work.
These developments were mainly carried out by the companies mentioned above, some of which in the meantime underwent changes in ownership, but even now with the new name they are the current major players, such as Bruker (formerly Siemens), Malvern Panalytical (formerly Philips), and Thermo Fisher (formerly Bausch & Lomb). Parallel developments were also made in Japan – here mainly Rigaku has to be mentioned.
Читать дальшеИнтервал:
Закладка:
Похожие книги на «X-Ray Fluorescence Spectroscopy for Laboratory Applications»
Представляем Вашему вниманию похожие книги на «X-Ray Fluorescence Spectroscopy for Laboratory Applications» списком для выбора. Мы отобрали схожую по названию и смыслу литературу в надежде предоставить читателям больше вариантов отыскать новые, интересные, ещё непрочитанные произведения.


Обсуждение, отзывы о книге «X-Ray Fluorescence Spectroscopy for Laboratory Applications» и просто собственные мнения читателей. Оставьте ваши комментарии, напишите, что Вы думаете о произведении, его смысле или главных героях. Укажите что конкретно понравилось, а что нет, и почему Вы так считаете.