Jörg Flock - X-Ray Fluorescence Spectroscopy for Laboratory Applications
Здесь есть возможность читать онлайн «Jörg Flock - X-Ray Fluorescence Spectroscopy for Laboratory Applications» — ознакомительный отрывок электронной книги совершенно бесплатно, а после прочтения отрывка купить полную версию. В некоторых случаях можно слушать аудио, скачать через торрент в формате fb2 и присутствует краткое содержание. Жанр: unrecognised, на английском языке. Описание произведения, (предисловие) а так же отзывы посетителей доступны на портале библиотеки ЛибКат.
- Название:X-Ray Fluorescence Spectroscopy for Laboratory Applications
- Автор:
- Жанр:
- Год:неизвестен
- ISBN:нет данных
- Рейтинг книги:5 / 5. Голосов: 1
-
Избранное:Добавить в избранное
- Отзывы:
-
Ваша оценка:
X-Ray Fluorescence Spectroscopy for Laboratory Applications: краткое содержание, описание и аннотация
Предлагаем к чтению аннотацию, описание, краткое содержание или предисловие (зависит от того, что написал сам автор книги «X-Ray Fluorescence Spectroscopy for Laboratory Applications»). Если вы не нашли необходимую информацию о книге — напишите в комментариях, мы постараемся отыскать её.
on using X-ray fluorescence for laboratory applications
This book focuses on the practical aspects of X-ray fluorescence (XRF) spectroscopy and discusses the requirements for a successful sample analysis, such as sample preparation, measurement techniques and calibration, as well as the quality of the analysis results.
X-Ray Fluorescence Spectroscopy for Laboratory Applications
X
An important resource for the analytical chemist, providing concrete guidelines and support for everyday analyses Focuses on daily laboratory work with commercially available devices Offers a unique compilation of knowledge and best practices from equipment manufacturers and users Covers the entire work process: sample preparation, the actual measurement, data processing, assessment of uncertainty, and accuracy of the obtained results
appeals to analytical chemists, analytical laboratories, materials scientists, environmental chemists, chemical engineers, biotechnologists, and pharma engineers.
X-Ray Fluorescence Spectroscopy for Laboratory Applications — читать онлайн ознакомительный отрывок
Ниже представлен текст книги, разбитый по страницам. Система сохранения места последней прочитанной страницы, позволяет с удобством читать онлайн бесплатно книгу «X-Ray Fluorescence Spectroscopy for Laboratory Applications», без необходимости каждый раз заново искать на чём Вы остановились. Поставьте закладку, и сможете в любой момент перейти на страницу, на которой закончили чтение.
Интервал:
Закладка:
All these interactions depend on both the analyzed material and the energy of the radiation, as shown in the diagrams in Figure 2.5for the elements (a) carbon and (b) lead. They show that in the energy range of about 0.5–40 keV, absorption dominates. Rayleigh scattering contributes a fraction of less than 1% for low energies. At higher energies, Compton scattering dominates the radiation attenuation coefficient.
2.2.4.1 Absorption
Absorption will be understood merely as the attenuation of the incident X-ray radiation by the ionization of atoms. This process is described by the element- and energy-dependent photoionization coefficient. It increases with higher atomic number and decreases with increasing energy as can be seen in Figure 2.5. This energy dependence can be approximated by τ ≈ E −3. The curve does show discontinuities that manifest themselves as jumps. They occur when the energy of the absorbed radiation is sufficient to ionize a new electron shell, i.e. a new interaction mechanism is added. In the diagrams in Figure 2.5, this applies to Pb for the excitation of M, L, and K radiation at energies of approximately 3, 15, and 88 keV, respectively. The energy of the K-absorption edge of C, on the other hand, is 0.283 keV and is therefore not displayed in the diagram.
Table 2.2 Comparison of line designations for the main X-ray lines.
| Siegbahn | IUPAC | Siegbahn | IUPAC | Siegbahn | IUPAC |
|---|---|---|---|---|---|
| Kα 1 | K–L3 | Lα 1 | L3–M5 | Mα 1 | M5–N7 |
| Kα 2 | K–L2 | Lα 2 | L3–M4 | Mα 2 | M5–N6 |
| Kß 1 | K–M3 | Lß 1 | L2–M4 | Mβ | M4–N6 |
| Kß 2 | K–N3 | Lß 2 | L3–N5 | Mγ | M3–N5 |
| Kß 3 | K–M2 | Lß 3 | L1–M3 | Mξ | M4,5–N2,3 |
| Kß 4 | K–N5,4 | Lß 4 | L1–M2 | ||
| Kß 5 | K–M4,5 | Lß 5 | L2–O4,5 | ||
| Lß 6 | L3–N1 | ||||
| Lγ 1 | L2–N4 | ||||
| Lγ 2 | L1–N2 | ||||
| Lγ 3 | L1–N3 | ||||
| Lγ 4 | L1–O3 | ||||
| Lγ 5 | L2–N1 | ||||
| Lγ 6 | L2–O4 | ||||
| Lη | L2–M1 |
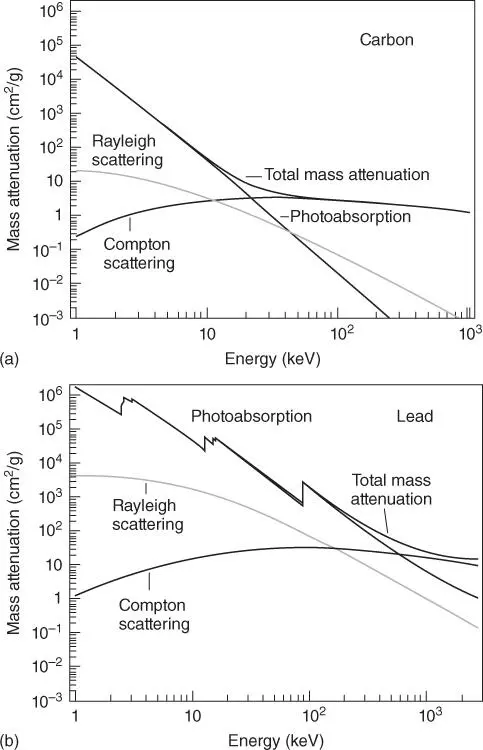
Figure 2.5 Contributions to the attenuation coefficient for X-radiation of (a) carbon and (b) lead.
2.2.4.2 Scattering
Scattering is the most important origin of the spectral background in X-ray spectrometry. The incident radiation is scattered at the electrons of the atoms of the sample. The scattering can be both elastic (Rayleigh or coherent scattering) and inelastic (Compton or incoherent scattering). All electrons of an atom contribute to the elastic scattering, i.e. the scattering intensity is proportional to the number of electrons or to the atomic number. Inelastic scattering can occur only at weakly bonded, i.e. outer electrons. Therefore, its intensity is mostly independent of the atomic number. This is demonstrated in Figure 2.6showing the scatter coefficients for a few elements for an energy of 20 keV, which is close to Rh-Kα-radiation, the most often used target material for spectroscopic X-ray tubes (Section 5.3.2.1). The coefficients for the Rayleigh (elastic) scattering increase approximately proportionally with the atomic number whereas the coefficients for the Compton (inelastic) scattering show only a small dependence on atomic number; only for the lightest elements they are slightly larger than for most other elements.
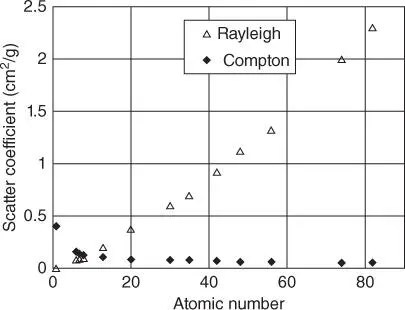
Figure 2.6 Elastic and inelastic scattering coefficients for selected elements at 20 keV.
This means, that the ratio I inelastic/ I elasticis dependent on the sample composition. For light matrices the ratio is large due to the small contribution of elastic scattering, and for heavy matrices it is small due to the larger contribution of elastic scattering. This is demonstrated in Figure 2.7. Panel (a) shows the elastically and inelastically scattered fluorescence radiation of the X-ray tube for four different samples normalized to the Compton peak of the scattered Rh-Kα-radiation of the tube. Panel (b) shows the ratio of inelastic and elastic scattered fluorescence radiation of the X-ray tube as a function of the mean atomic number of the sample for a given measurement geometry. This different scattering behavior can be helpful in the quantitative analysis of the sample.
With the help of the Compton–Rayleigh ratio the mean atomic number of the sample can be determined. The mean atomic number can then be used for an averaged description of the absorption properties of the sample. Another application is the normalization of the fluorescence intensity of analytes to the Compton intensity. Knowledge of the mean atomic number of the sample can be further used to determine elements that cannot be measured by XRF, such as oxygen in oxides, as a difference to 100 wt%.
The continuous background of a spectrum is mainly caused by the scattered continuous bremsstrahlung of the X-ray tube at the sample, both by elastic and inelastic scattering. As demonstrated in Figure 2.7, the elastic scattering decreases with decreasing average atomic number of the sample. Nevertheless, the intensity of the scattered tube radiation is considerable in relation to the fluorescence intensity of the light matrix elements. This is also caused by the limited excitation efficiency and the very small fluorescence yield for these elements (see Figure 2.4). On the other hand, due to the high fluorescence yield for heavier elements the ratio between fluorescence radiation and the spectral background is larger even if here the elastic scattering and consequently also the spectral background have a higher intensity. This is demonstrated in Figure 2.8for the spectra already shown in Figure 2.7a. However, Figure 2.8shows the direct measured, non-normalized spectra. Here it can be clearly seen that the background of the spectra of polymethylmethacrylate (PMMA) and Al are large compared to the fluorescence lines. On the other hand, the spectra of Ti and Ni have higher fluorescence intensities and therefore a lower spectral background.
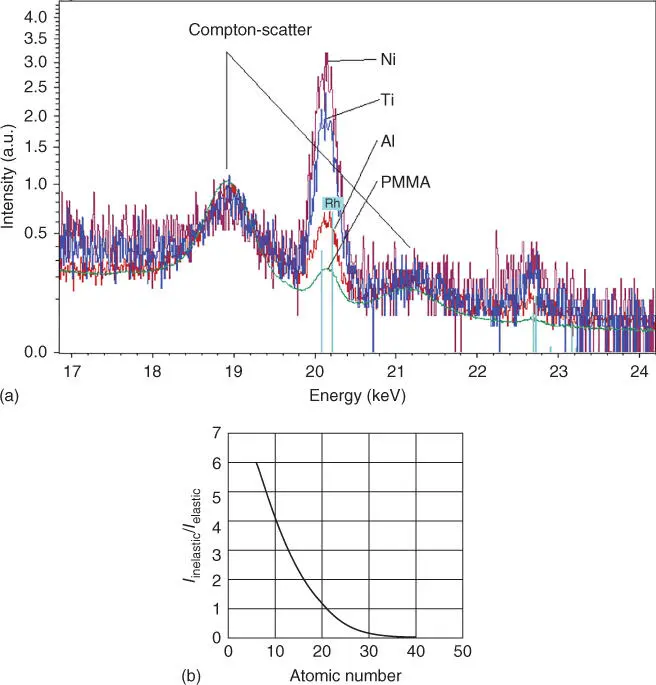
Figure 2.7 (a) Influence of the sample type on the intensity of the scattered radiation (y axis in square root scale) and (b) ratio of elastic and inelastic scattering intensities on the average atomic number of the sample.
In addition to the fluorescence lines of the metal samples diffraction lines can also be detected as a result of Bragg-reflection of the continuous tube radiation at crystalline structures of the sample, see also Section 4.2.6.3.
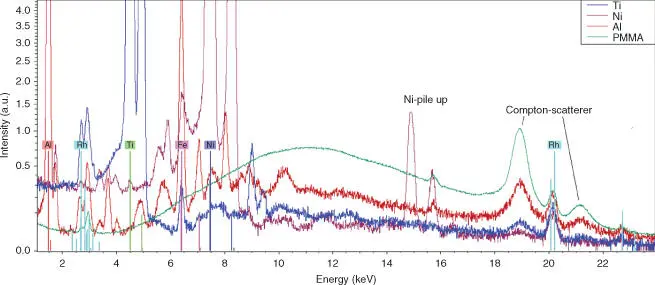
Figure 2.8 Spectra of PMMA, Al, Ti, and Ni demonstrating the different scatter behavior ( y -axis in square root scale).
Читать дальшеИнтервал:
Закладка:
Похожие книги на «X-Ray Fluorescence Spectroscopy for Laboratory Applications»
Представляем Вашему вниманию похожие книги на «X-Ray Fluorescence Spectroscopy for Laboratory Applications» списком для выбора. Мы отобрали схожую по названию и смыслу литературу в надежде предоставить читателям больше вариантов отыскать новые, интересные, ещё непрочитанные произведения.


Обсуждение, отзывы о книге «X-Ray Fluorescence Spectroscopy for Laboratory Applications» и просто собственные мнения читателей. Оставьте ваши комментарии, напишите, что Вы думаете о произведении, его смысле или главных героях. Укажите что конкретно понравилось, а что нет, и почему Вы так считаете.