Encyclopedia of Glass Science, Technology, History, and Culture
Здесь есть возможность читать онлайн «Encyclopedia of Glass Science, Technology, History, and Culture» — ознакомительный отрывок электронной книги совершенно бесплатно, а после прочтения отрывка купить полную версию. В некоторых случаях можно слушать аудио, скачать через торрент в формате fb2 и присутствует краткое содержание. Жанр: unrecognised, на английском языке. Описание произведения, (предисловие) а так же отзывы посетителей доступны на портале библиотеки ЛибКат.
- Название:Encyclopedia of Glass Science, Technology, History, and Culture
- Автор:
- Жанр:
- Год:неизвестен
- ISBN:нет данных
- Рейтинг книги:3 / 5. Голосов: 1
-
Избранное:Добавить в избранное
- Отзывы:
-
Ваша оценка:
Encyclopedia of Glass Science, Technology, History, and Culture: краткое содержание, описание и аннотация
Предлагаем к чтению аннотацию, описание, краткое содержание или предисловие (зависит от того, что написал сам автор книги «Encyclopedia of Glass Science, Technology, History, and Culture»). Если вы не нашли необходимую информацию о книге — напишите в комментариях, мы постараемся отыскать её.
The
has been designed to satisfy the needs and curiosity of a broad audience interested in the most varied aspects of material that is as old as the universe. As described in over 100 chapters and illustrated with 1100 figures, the practical importance of glass has increased over the ages since it was first man-made four millennia ago. The old-age glass vessels and window and stained glass now coexist with new high-tech products that include for example optical fibers, thin films, metallic, bioactive and hybrid organic-inorganic glasses, amorphous ices or all-solid-state batteries.
In the form of scholarly introductions, the Encyclopedia chapters have been written by 151 noted experts working in 23 countries. They present at a consistent level and in a self-consistent manner these industrial, technological, scientific, historical and cultural aspects. Addressing the most recent fundamental advances in glass science and technology, as well as rapidly developing topics such as extra-terrestrial or biogenic glasses, this important guide:
Begins with industrial glassmaking Turns to glass structure and to physical, transport and chemical properties Deals with interactions with light, inorganic glass families and organically related glasses Considers a variety of environmental and energy issues And concludes with a long section on the history of glass as a material from Prehistory to modern glass science The
has been written not only for glass scientists and engineers in academia and industry, but also for material scientists as well as for art and industry historians. It represents a must-have, comprehensive guide to the myriad aspects this truly outstanding state of matter.
Encyclopedia of Glass Science, Technology, History, and Culture — читать онлайн ознакомительный отрывок
Ниже представлен текст книги, разбитый по страницам. Система сохранения места последней прочитанной страницы, позволяет с удобством читать онлайн бесплатно книгу «Encyclopedia of Glass Science, Technology, History, and Culture», без необходимости каждый раз заново искать на чём Вы остановились. Поставьте закладку, и сможете в любой момент перейти на страницу, на которой закончили чтение.
Интервал:
Закладка:
The true vDOS given by Eq. (12)is not directly accessible in experiments, in which only an effective vDOS, G ( ω ) = C ( ω ) g ( ω ), can be measured. The function C ( ω ) describes how the modes with frequency ω are coupled to the probing radiation (photons, neutrons, etc.). For inelastic neutron‐scattering experiments, this function can be derived, within approximations, from the eigenvectors e pof the dynamical matrix [21].
In practice, the vibrational properties of a system can be calculated in two different ways. The first is to determine the local potential minimum of the glass structure (i.e. to quench the sample to T = 0 K) and then to calculate directly the dynamical matrix, for instance, by a finite‐difference scheme for the forces. By diagonalizing this matrix, one can then obtain its eigenfrequencies and eigenvectors and, hence, g ( ω ). The second method consists in running a simulation in which one solves Newton’s equations of motion at low temperatures where the harmonic approximation is valid. If one measures the time autocorrelation function of the velocity of a particle, its time Fourier transform is directly proportional to the vDOS. This approach is from the computational point of view cheap, but it has the drawback of not giving any information on the eigenvectors, i.e. on the nature of the motion of the atoms.
The advantages of ab initio over effective pair‐potential simulations are illustrated by the neutron‐effective vDOS for silica ( Figure 4). The effective potentials give a surprisingly good description of the structural properties of real silica [23] and also of the high‐frequency vDOS where modes concern intra‐tetrahedral excitations [18]. However, the vDOS calculation with the effective potential gives a broad, flat band between 200 and 600 cm −1whereas the ab initio simulations show, in agreement with the experimental data, a marked peak at around 400 cm −1[17].
A further technique used to get insight into the vibrational properties of glasses are measurements of dielectric properties ( Chapter 3.4), which are directly related to the local polarizability of the material. Because ab initio simulations do give a good description of polarizability, they allow the high‐frequency (ɛ ∞) and static dielectric constant ( ɛ 0) to be accessed directly. Also called relative permittivity, the former quantity can be estimated as one third of the trace of the purely electronic dielectric tensor 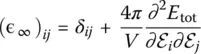 , which describes the reaction of the electrons to the presence of an external electric field if the ions were kept at fixed positions. For a glass, this tensor is basically isotropic and diagonal. The static dielectric constant ɛ 0reflects the ionic displacement contributions to the dielectric constant and it can be expressed as [24]:
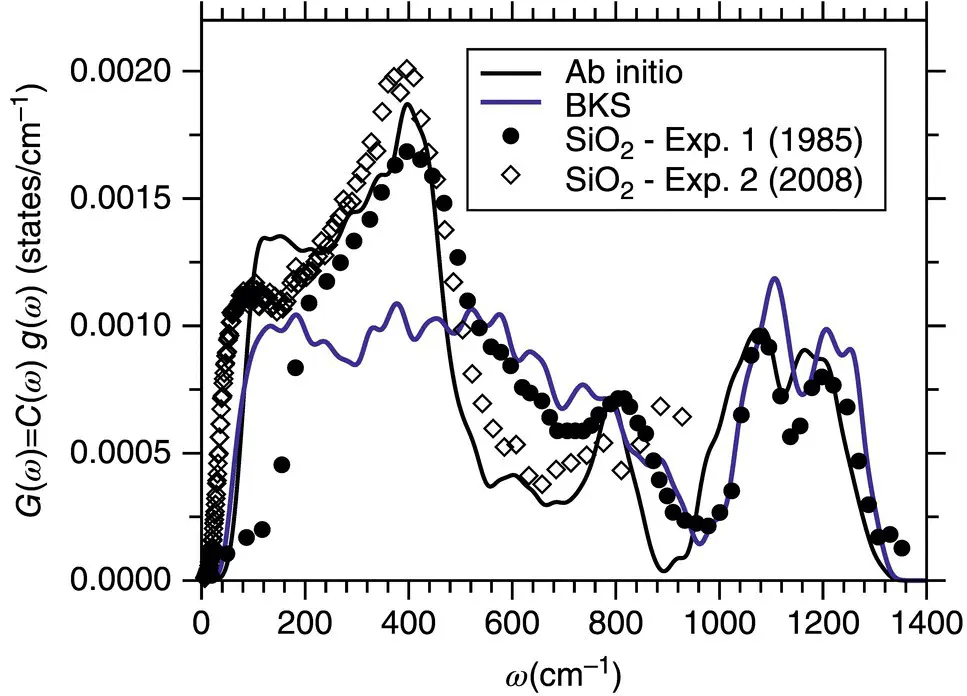
Figure 4 Effective neutron densities of states for a‐SiO 2as obtained from an ab initio simulation (solid black line) and a simulation with an effective force field (solid blue line), after [17]. Symbols: Data from two neutron scattering experiments [22].
(13) 
where p runs over all the eigenmodes, and  is the so‐called oscillator strength which is defined as
(14) 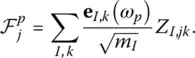
Here, e I,k( ω p) is the part of the eigenvector e( ω p) that contains the three components of particle I , and the quantity Z I,jkis the Born effective charge tensor defined as:
(15) 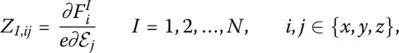
where e is the elementary charge, i.e. Z I,ijis an effective charge that connects the strength of an external electric field ℰ to the force F Ion particle I .
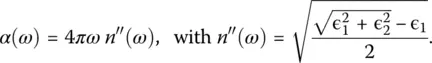
These quantities allow to obtain immediately the real and imaginary parts of the dielectric function ɛ ( ω ) = ɛ 1( ω ) + iɛ 2( ω ) [24]:
(16) 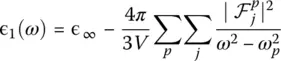
(17) 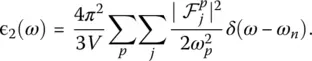
Closely related to ɛ ( ω ) is the absorption spectra α ( ω ) which is given by
(18) 
All these functions can be measured directly. On one side, they allow to test the predictive power of the simulations and, on the other, they help to interpret the various features found in the experimental spectra. For the infrared spectra of amorphous silica ( Figure 5a–c), the theoretical calculation reliably predicts the position of the various peaks although their widths do not match very well the experimental data [18]. For the more complex NBS glass, a broad band is observed below 300 cm −1where the vDOS is strongly dominated by the motion of Na atoms [6], which explains why the spectra of alkali‐free glass‐formers lack such a low‐frequency band. In contrast, the narrow band found slightly above 400 cm −1is also present in the spectrum of pure silica where it has been assigned to the bending and rocking motion of oxygen atoms [16]. Therefore, this peak has probably the same origin in NBS as in SiO 2although it is somewhat broader and shifted to lower frequencies as a result of a more disordered structure.
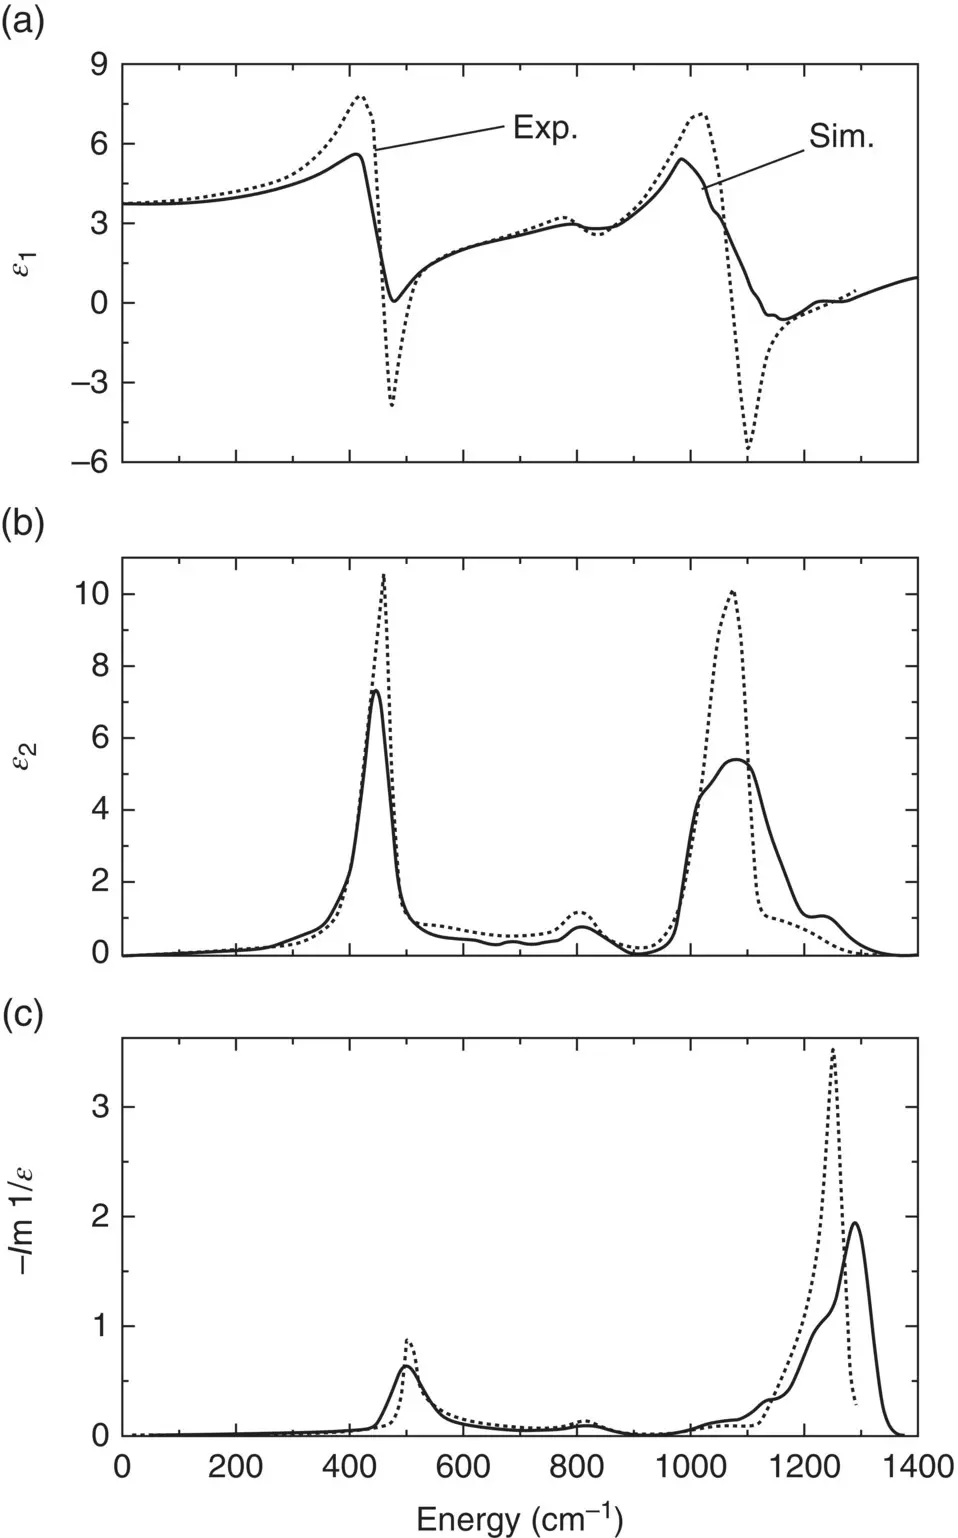
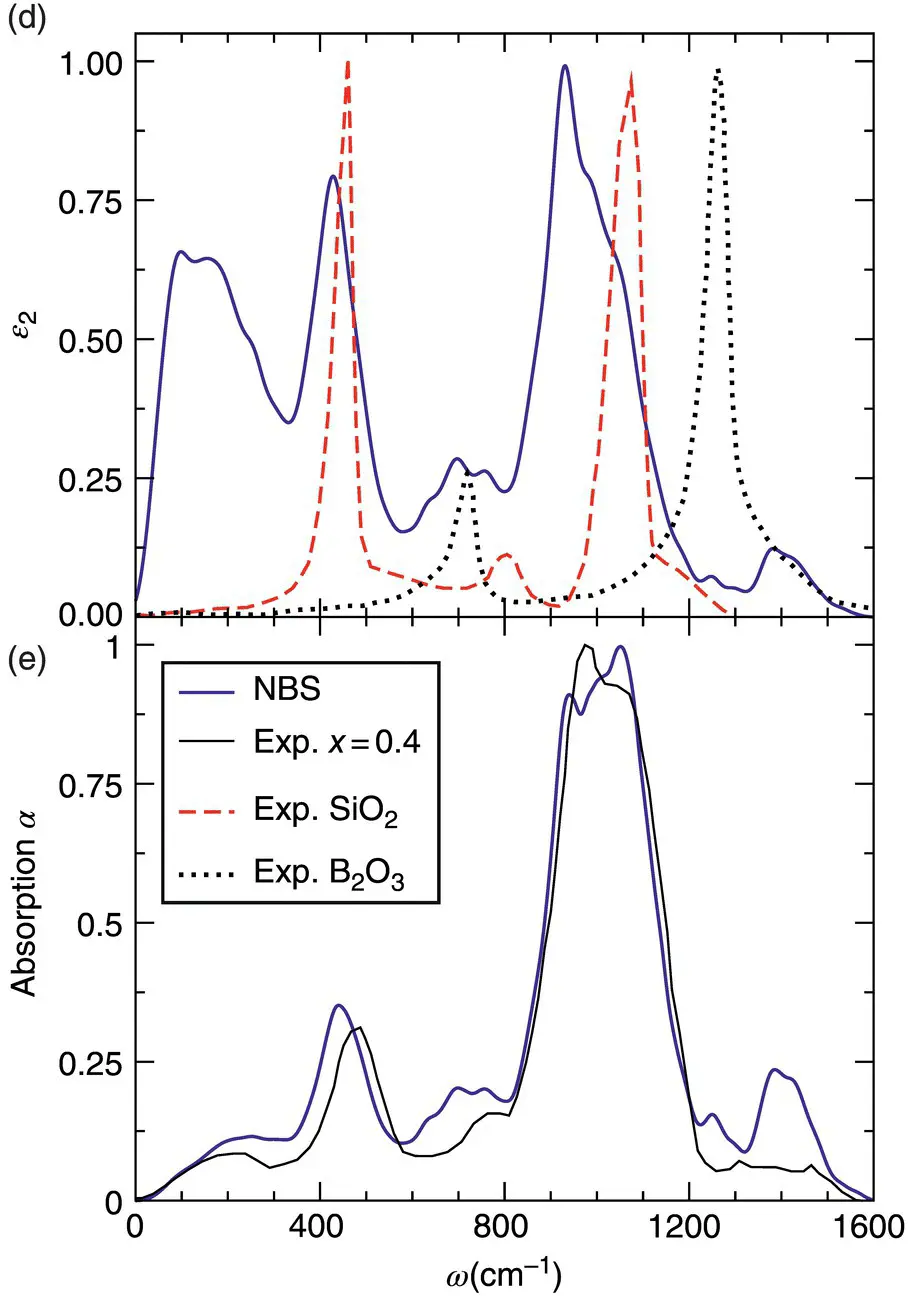
Figure 5 (a)–(c): Infrared spectra for amorphous SiO 2as obtained from ab initio simulations (solid lines) and from experiments (dotted lines) [18]. (d) and (e): Infrared spectra for a sodium borosilicate glass as obtained from ab initio calculations and compared to experimental data for pure SiO 2and B 2O 3glasses, as well as for a sodium borosilicate glass with a similar composition [6].
At high frequencies one finds two bands. The first one, ranging from 850 to 1200 cm −1, can be assigned to oxygen stretching modes of Si─O bonds. That this band lies at lower frequencies than for silica (sharp peak at around 1070 cm −1) is consistent with earlier results showing that the presence of non‐bridging oxygen atoms shifts the band to lower frequencies [19]. The second band extends between 1200 and 1600 cm −1, and is due to the motions of oxygen atoms belonging to [3]B, in agreement with the fact that B 2O 3, which has mainly [3]B units, shows a very pronounced peak in this frequency range. Regarding absorption, good agreement is again found between the spectrum of NBS and the ab initio calculations made for a closely related composition ( Figure 5d and e). The main deviation is found at high frequency where a peak is absent in the experimental spectrum but present in the simulation, since the latter overestimated the concentration of [3]B units because of the high quenching rate [6].
Читать дальшеИнтервал:
Закладка:
Похожие книги на «Encyclopedia of Glass Science, Technology, History, and Culture»
Представляем Вашему вниманию похожие книги на «Encyclopedia of Glass Science, Technology, History, and Culture» списком для выбора. Мы отобрали схожую по названию и смыслу литературу в надежде предоставить читателям больше вариантов отыскать новые, интересные, ещё непрочитанные произведения.


Обсуждение, отзывы о книге «Encyclopedia of Glass Science, Technology, History, and Culture» и просто собственные мнения читателей. Оставьте ваши комментарии, напишите, что Вы думаете о произведении, его смысле или главных героях. Укажите что конкретно понравилось, а что нет, и почему Вы так считаете.