Encyclopedia of Glass Science, Technology, History, and Culture
Здесь есть возможность читать онлайн «Encyclopedia of Glass Science, Technology, History, and Culture» — ознакомительный отрывок электронной книги совершенно бесплатно, а после прочтения отрывка купить полную версию. В некоторых случаях можно слушать аудио, скачать через торрент в формате fb2 и присутствует краткое содержание. Жанр: unrecognised, на английском языке. Описание произведения, (предисловие) а так же отзывы посетителей доступны на портале библиотеки ЛибКат.
- Название:Encyclopedia of Glass Science, Technology, History, and Culture
- Автор:
- Жанр:
- Год:неизвестен
- ISBN:нет данных
- Рейтинг книги:3 / 5. Голосов: 1
-
Избранное:Добавить в избранное
- Отзывы:
-
Ваша оценка:
Encyclopedia of Glass Science, Technology, History, and Culture: краткое содержание, описание и аннотация
Предлагаем к чтению аннотацию, описание, краткое содержание или предисловие (зависит от того, что написал сам автор книги «Encyclopedia of Glass Science, Technology, History, and Culture»). Если вы не нашли необходимую информацию о книге — напишите в комментариях, мы постараемся отыскать её.
The
has been designed to satisfy the needs and curiosity of a broad audience interested in the most varied aspects of material that is as old as the universe. As described in over 100 chapters and illustrated with 1100 figures, the practical importance of glass has increased over the ages since it was first man-made four millennia ago. The old-age glass vessels and window and stained glass now coexist with new high-tech products that include for example optical fibers, thin films, metallic, bioactive and hybrid organic-inorganic glasses, amorphous ices or all-solid-state batteries.
In the form of scholarly introductions, the Encyclopedia chapters have been written by 151 noted experts working in 23 countries. They present at a consistent level and in a self-consistent manner these industrial, technological, scientific, historical and cultural aspects. Addressing the most recent fundamental advances in glass science and technology, as well as rapidly developing topics such as extra-terrestrial or biogenic glasses, this important guide:
Begins with industrial glassmaking Turns to glass structure and to physical, transport and chemical properties Deals with interactions with light, inorganic glass families and organically related glasses Considers a variety of environmental and energy issues And concludes with a long section on the history of glass as a material from Prehistory to modern glass science The
has been written not only for glass scientists and engineers in academia and industry, but also for material scientists as well as for art and industry historians. It represents a must-have, comprehensive guide to the myriad aspects this truly outstanding state of matter.
Encyclopedia of Glass Science, Technology, History, and Culture — читать онлайн ознакомительный отрывок
Ниже представлен текст книги, разбитый по страницам. Система сохранения места последней прочитанной страницы, позволяет с удобством читать онлайн бесплатно книгу «Encyclopedia of Glass Science, Technology, History, and Culture», без необходимости каждый раз заново искать на чём Вы остановились. Поставьте закладку, и сможете в любой момент перейти на страницу, на которой закончили чтение.
Интервал:
Закладка:
For the boron‐oxygen pair ( Figure 1a), the first peak of the radial distribution function is relatively large and slightly asymmetric. By considering three‐ and fourfold coordinated boron atoms, [3]B and [4]B, respectively, we can decompose this peak into two contributions and see that the broadening of the total peak is a consequence of the presence of these two populations, the [3]B─O and [4]B─O bonds giving rise to the smaller and larger distances, respectively. We can decompose these distributions further by considering the nature of the second nearest neighbor of the central boron atoms, i.e. whether the nearest oxygen is bridging connected to a Si or B atom, or whether it is a non‐bridging oxygen. We see that for the case of the [3]B atoms, the nature of this second nearest neighbor species influences the B─O distance since the position of the corresponding peak depends on the species, whereas this is not the case for the length of the [4]B─O bonds. The presence of [3]B and [4]B units is also reflected in the OBO triplet angle distribution (shown in Figure 1b) by the presence of two peaks.
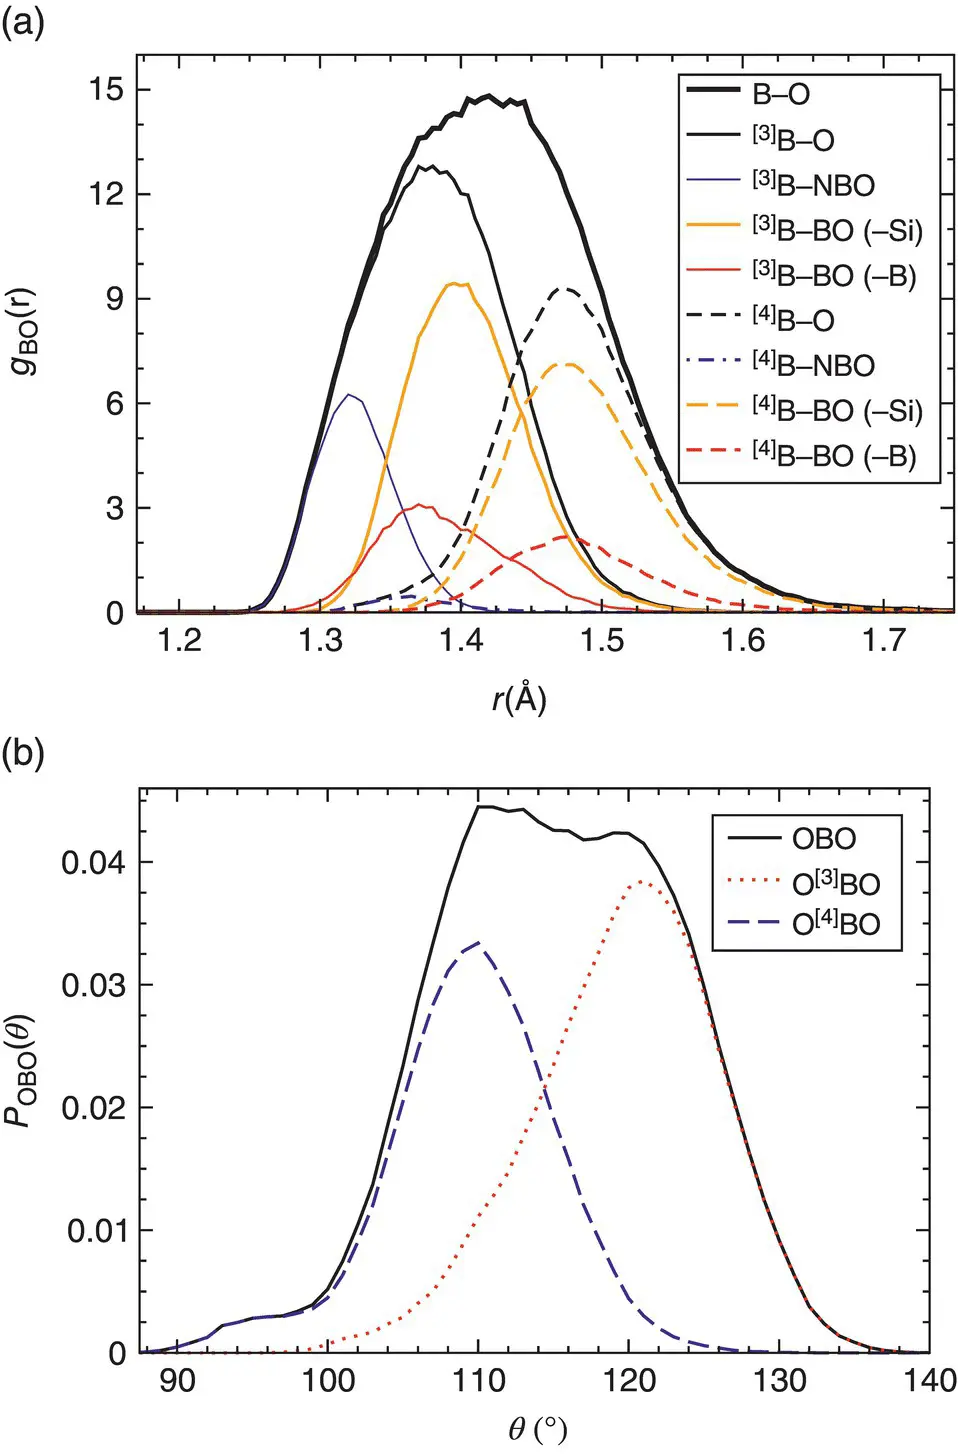
Figure 1 Contributions of the various structural units of a sodium borosilicate glass to structural features [6]. (a) Distribution of B─O distances around a given B atom as given by the first peak of the partial radial‐distribution function. (b) Distribution of the angle formed by two oxygens connected to the same boron.
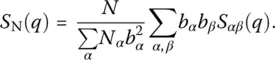
Although this detailed information is valuable to understand better the local structure of the glass, it is also important to connect the results from the simulation with experimental data. Even if radial distribution functions cannot be directly accessed experimentally, it is possible to measure the static structure factor, which is directly related to the weighted sum of S αβ( q ), the space Fourier transform of g αβ( R ) [14]. For neutron scattering, one finds, for example:
(9) 
Here, b αis the neutron scattering length of particles of species α [14] and the partial static structure factors are given by
(10) 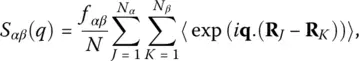
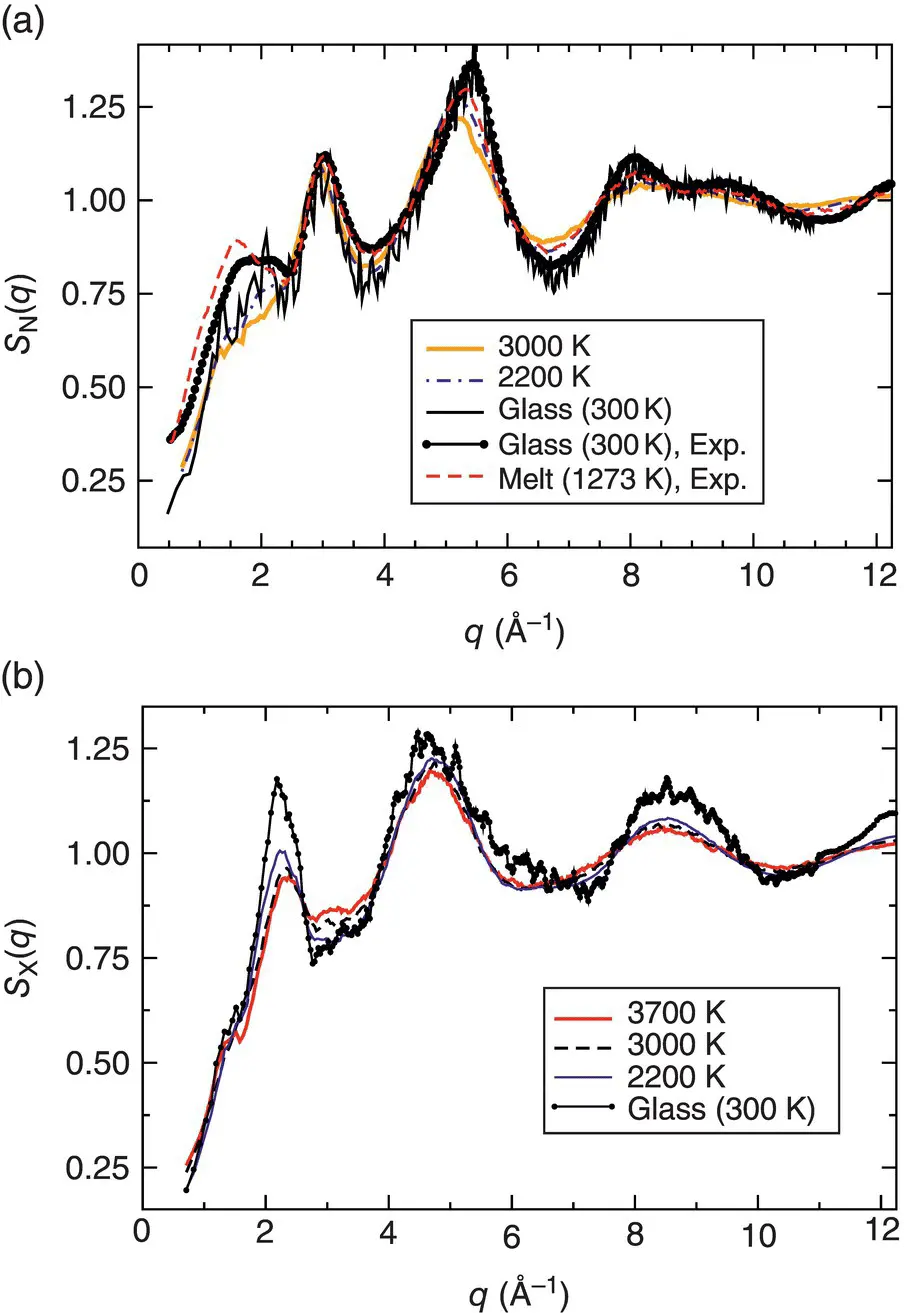
Figure 2 Neutron and X‐ray structural factors (a and b panel, respectively) for a borosilicate system in the liquid and glass state.
Source: From Ref. [6].
where N is the total number of atoms and f αβ= 1 for α = β and f αβ= 1/2 otherwise. For X‐ray scattering, the relation is
(11) 
where f α( s ) is the scattering‐factor function (also called form factor). Figure 2shows that even for the same glass sample, S N( q ) and S X( q ) are rather different since both are a weighted sum of the partial structure factors, each of which has a multitude of positive and negative peaks. Hence, the resulting sum may show a peak for S N( q ) that is basically absent in S X( q ). Since interpretation of experimental data is further complicated by the fact that one has k ( k + 1)/2 partial structure factors in systems with k species, computer simulations can help to interpret correctly the various peaks if they do reproduce the partial structure factors in terms of peak positions and heights. As a matter of fact, the necessary accuracy is usually ensured only by ab initio simulations.
Another important situation is that of surfaces, for which experimental scattering techniques involving grazing‐ray geometries are much less powerful to obtain microscopic information. Because effective potentials are usually developed for bulk systems, their reliability is not guaranteed for surfaces for which the local structure can be very different. One example are two‐membered rings in SiO 2that are present at the surface but absent in the bulk. Hence, ab initio simulations are to be preferred for investigating surfaces since they can deal with such heterogeneous geometries.
One interesting example of surface effects is the difference between the interatomic distance and bond‐angle distributions of water molecules in the bulk and adsorbed at the surface of amorphous silica ( Figure 3). Although there are no significant differences in the positions of the O─O and O─H peaks ( Figure 3a), close to the surface the fluid is less structured than in the bulk as signaled by smaller peaks. Likewise, differences concerning the angle between water dipole (i.e. the bisector of the HOH angle) and the surface normal ( Figure 3b) indicate a strong change of the local geometry. Only accurate interaction potentials, such as ab initio simulations will be able to pick up these effects.
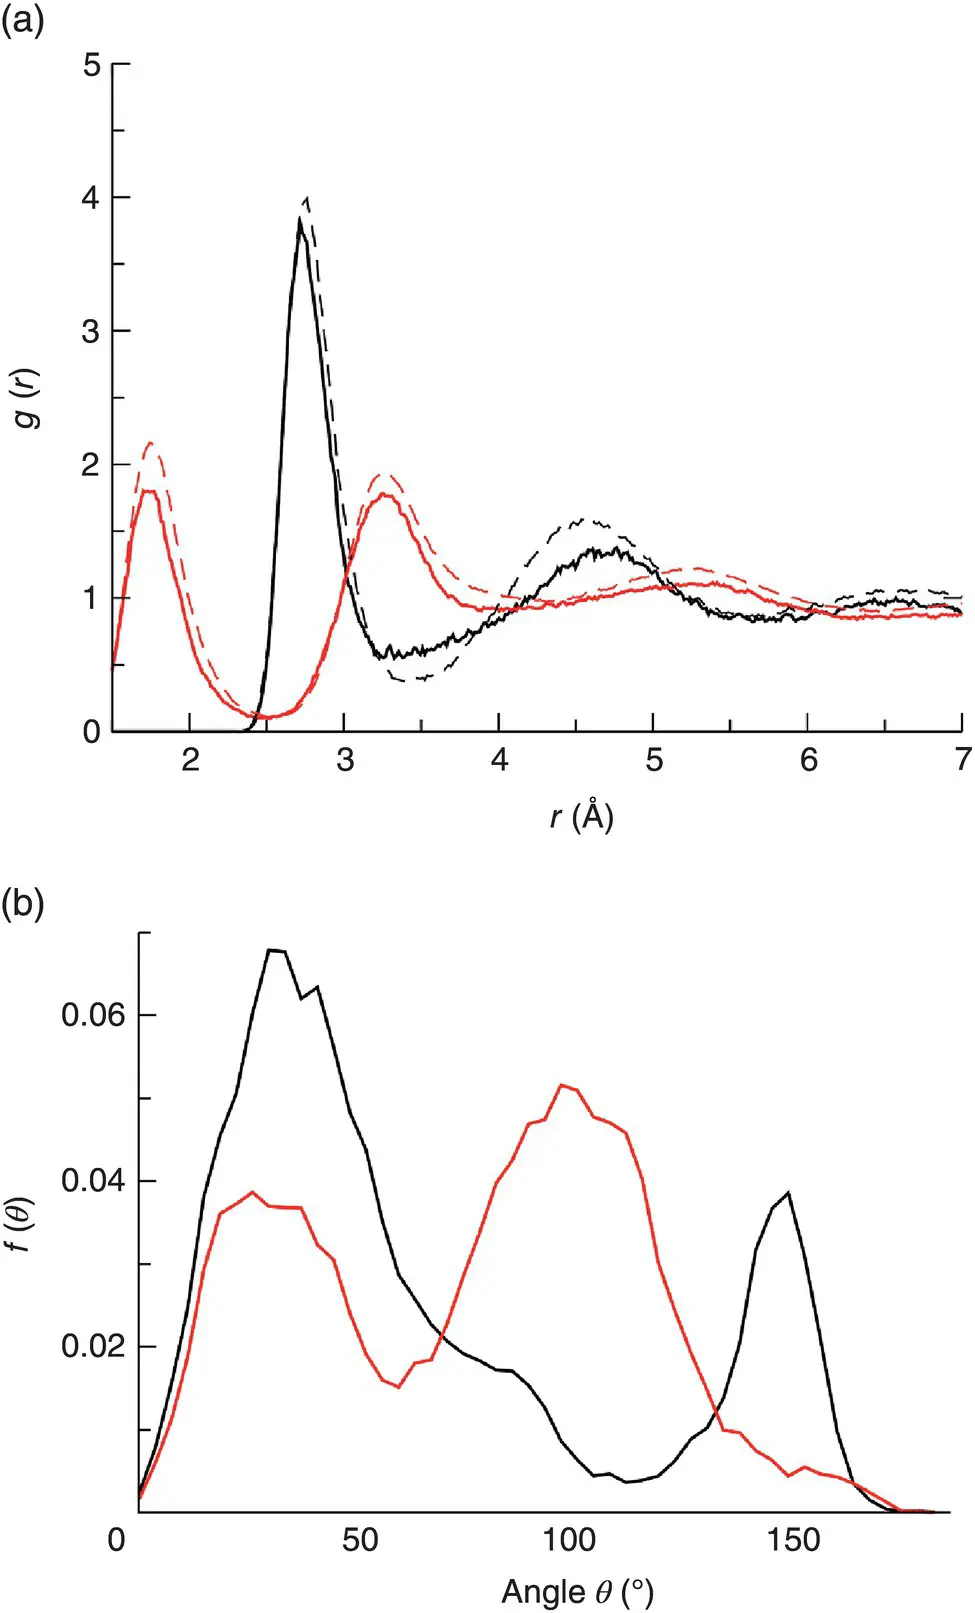
Figure 3 Structural differences between bulk (BW) and surface (SW) water in SiO 2glass [15]. (a) Water–water radial distribution function. (b) Distribution of the angle θ between the water dipole (bisecting the HOH angle) and the surface normal.
4 Vibrational Properties
The vibrational density of states (vDOS) g ( ω ) is the normalized distribution function of the eigenfrequencies ω pof the dynamical matrix of the system which is directly related to the second derivative of the potential with respect to the coordinates R Iand R J, i.e. ∂ 2 Φ/( ∂ R I, i ∂ R J,j) for i , j ∈{ x , y , z }, thus
( 12) 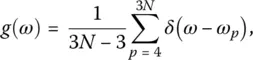
where 3 N − 3 is the number of eigenmodes with nonzero frequency. Associated with each eigenfrequency ω pof the dynamical matrix is an eigenvector e pthat gives detailed information regarding the particles that oscillate with the frequency ω p. Studies of e phave allowed to gain insight into the nature of the vibrational modes of various materials such as silica and germania glasses [12, 16–18] and more complex systems ([6, 10, 11, 19], Chapter 3.4).
The structure of a solid is related to a balance of the forces between its atoms, i.e. to the first derivative of the potential since these forces must mutually compensate to ensure a mechanically stable equilibrium. In contrast, vibrational properties are related to the curvature of the potential, i.e. to its second derivatives. As a consequence, it is quite hard to find effective potentials that reproduce correctly the experimental vDOS, even for systems as simple as pure silica [20].
Читать дальшеИнтервал:
Закладка:
Похожие книги на «Encyclopedia of Glass Science, Technology, History, and Culture»
Представляем Вашему вниманию похожие книги на «Encyclopedia of Glass Science, Technology, History, and Culture» списком для выбора. Мы отобрали схожую по названию и смыслу литературу в надежде предоставить читателям больше вариантов отыскать новые, интересные, ещё непрочитанные произведения.


Обсуждение, отзывы о книге «Encyclopedia of Glass Science, Technology, History, and Culture» и просто собственные мнения читателей. Оставьте ваши комментарии, напишите, что Вы думаете о произведении, его смысле или главных героях. Укажите что конкретно понравилось, а что нет, и почему Вы так считаете.