EIB Investment Report 2020/2021
Здесь есть возможность читать онлайн «EIB Investment Report 2020/2021» — ознакомительный отрывок электронной книги совершенно бесплатно, а после прочтения отрывка купить полную версию. В некоторых случаях можно слушать аудио, скачать через торрент в формате fb2 и присутствует краткое содержание. Жанр: unrecognised, на английском языке. Описание произведения, (предисловие) а так же отзывы посетителей доступны на портале библиотеки ЛибКат.

- Название:EIB Investment Report 2020/2021
- Автор:
- Жанр:
- Год:неизвестен
- ISBN:нет данных
- Рейтинг книги:5 / 5. Голосов: 1
-
Избранное:Добавить в избранное
- Отзывы:
-
Ваша оценка:
EIB Investment Report 2020/2021: краткое содержание, описание и аннотация
Предлагаем к чтению аннотацию, описание, краткое содержание или предисловие (зависит от того, что написал сам автор книги «EIB Investment Report 2020/2021»). Если вы не нашли необходимую информацию о книге — напишите в комментариях, мы постараемся отыскать её.
EIB Investment Report 2020/2021 — читать онлайн ознакомительный отрывок
Ниже представлен текст книги, разбитый по страницам. Система сохранения места последней прочитанной страницы, позволяет с удобством читать онлайн бесплатно книгу «EIB Investment Report 2020/2021», без необходимости каждый раз заново искать на чём Вы остановились. Поставьте закладку, и сможете в любой момент перейти на страницу, на которой закончили чтение.
Интервал:
Закладка:
Profitability and cash holdings’ effect on investment

Source: EIBIS 2020 and EIBIS-Orbis matched database.
Note: The figure shows the 10 th, 25 th, 50 th, 75 thand 90 thpercentiles of firm-level cash to total assets.
Longer-term impact of the pandemic
While the pandemic may be brought under control sometime in the near future, it may have a permanent effect on the economy.The size and nature of the shock caused by the pandemic are such that it will likely trigger sweeping, structural changes in the economy, altering how we work, commute, travel and spend our holidays for many years to come. The evolution will likely modify investment priorities and employment patterns. Firms that do not invest in adapting to these changes might be left unprepared for future challenges.
The share of firms that do not have any investment plans in the next three years has increased compared to the average from 2016 to 2019 (Figure 16a).The share of small firms that do not plan to invest in the next three years has risen even faster. Smaller firms face greater difficulties in coping with the economic shock caused by the pandemic. The evidence is corroborated in Figure 15. Smaller firms that do not plan to invest over the next three years have significantly lower median productivity than smaller firms that plan to invest. The difference in productivity is largely absent for medium and large firms. It is therefore very likely that the consequences of the coronavirus on investment and productivity will be felt acutely in the medium term.
Digital technology is likely to become more widely used.Half of the firms in the European Union expect the use of digital technologies to increase because of the COVID-19 crisis. The share of firms that expect digital technology to increase is higher in Western and Northern Europe (53%) and on par with firms in the United States ( Figure 16b). In Southern and Central and Eastern Europe, the share is somewhat lower, but still above 40%. These high percentages underline the importance of investing in digital technologies if firms are to remain competitive (see Chapter 7).
Supply chains will change, along with product and service portfolios.More than a third of firms in the European Union expect long-term effects on their supply chains and product portfolios. These views were expressed in the wake of significant supply-chain disruptions in the first and second quarters of 2020. The results support expectations about structural changes in supply chains and in industries whose products and services are built around social interaction and face-to-face contact.
Figure 16
Firms’ assessment of the longer-term consequences of the pandemic
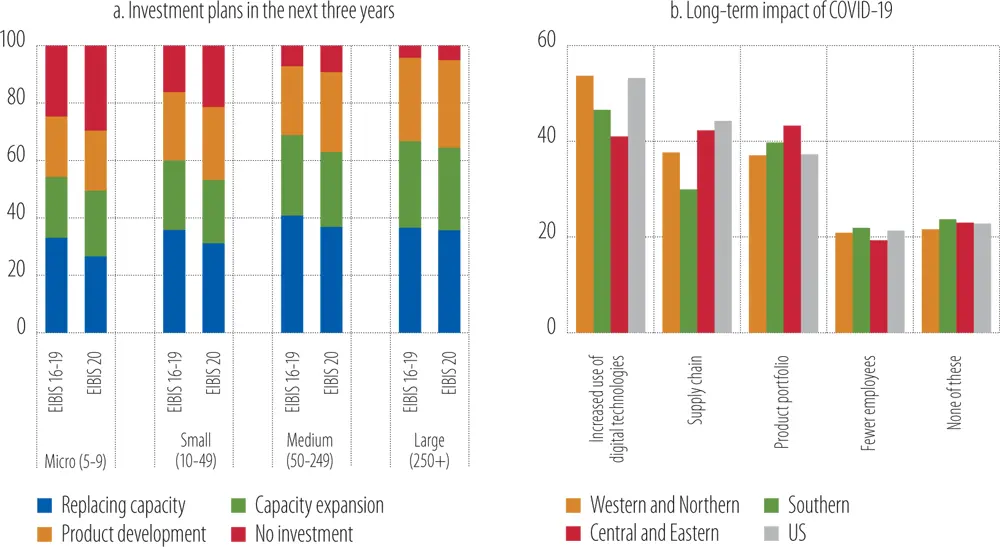
Source: EIBIS 2020.
About 20% of all firms estimate that the job cuts they made during the pandemic will be permanent.This share is constant across the European Union and in the United States. The aggregate effect of such a shock will be felt differently across the various countries, depending on their labour market institutions (Nickell, 1997). Economies whose labour markets are highly regulated may see a significant increase in structural unemployment, which could last for several years. While structural unemployment may not increase much in countries with more flexible regimes, a significant reduction of employment remains a challenge.
Infrastructure investment
Following a decade of contraction, the share of infrastructure investment in overall economic activity has been increasing since 2018 (Figure 17).The government and corporate sectors combined account for some 90% of EU infrastructure investment. While their shares are broadly equal, it was the corporate sector that provided the impetus for the recovery from the global financial crisis. The government sector’s share of infrastructure investment, on the other hand, contracted severely in 2016 when it barely attained 42% of overall infrastructure investment activity. In 2017 and 2018, it contributed to the recovery of infrastructure investment, with its share rising to 44%.[11] The share of project-based infrastructure investment remains just shy of 10% after a rebound in 2017. Previously, its share had steadily contracted from a high of some 16% in 2011 to a low of 8% in 2016. About two-thirds of projects are not carried out as a public private partnership (PPP). Since 2011, the aggregate value of PPP investments has declined steadily, whereas the aggregate value of non-PPP projects declined more forcefully through 2016 and have steadily risen since.
Figure 17
EU infrastructure investment by sector(% GDP)
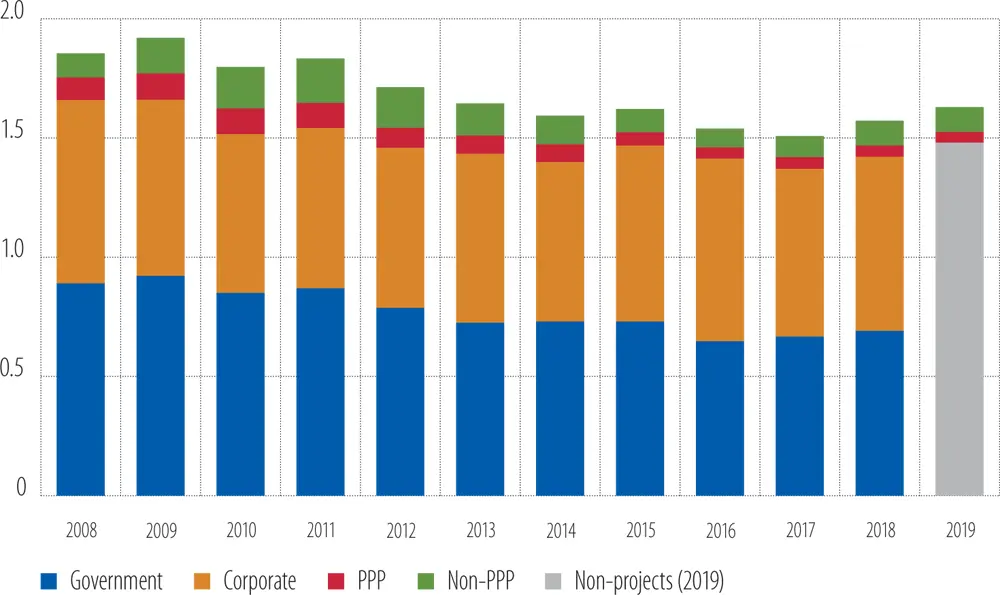
Source: EIB calculations, European PPP Expertise Centre (EPEC), Eurostat, IJ Global.
Note: Annual infrastructure investment in EU27 by institutional sector as a share of GDP, expressed as a percentage. Infrastructure projects are either PPP or non-PPP. The remainder is split between government and corporate investment; for 2019, data to calculate the government component are not available at the time of publication. Relevant data series are not published for Belgium, Croatia, Lithuania, Poland or Romania. Slight deviations from the 2018 results are due to a refinement in the estimate of depreciation of infrastructure investment, as well as the Brexit-induced recomposition to EU27.
In terms of asset type, investment in communications infrastructure has been the most dynamic component of the rebound.Education and transport infrastructure investment provided further support ( Figure 18). Transportation and utilities constitute some 60% of infrastructure investment assets. Though broadly equal in parts, the share of utilities has been declining steadily since a high of 33% in 2013, reaching a low of 27% in 2019. The share of social infrastructure assets in health and education is fairly stable, constituting about one-third of investment; typically, health accounts for about 60% of this though education steadily increased its share from 39% in 2016 to 43% in 2019. The smallest and most volatile share of infrastructure investment is attributable to communications. In 2019, it accounted for just over 7% of infrastructure investments.
Figure 18
EU infrastructure investment by asset class(% GDP)
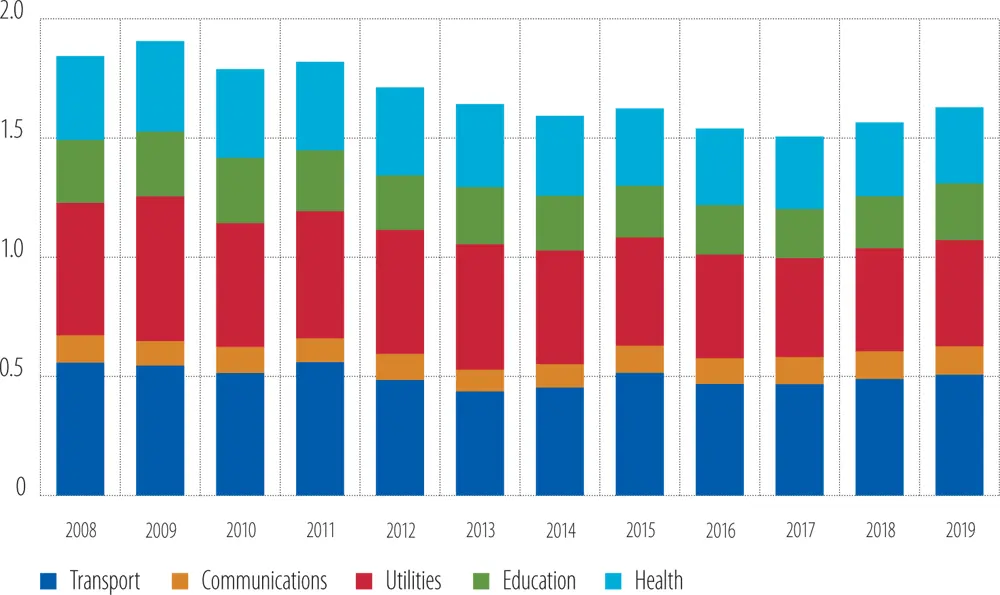
Source: EIB calculations, EPEC, Eurostat, IJ Global.
Note: Annual infrastructure investment in EU27 by infrastructure asset as a share of GDP, expressed as a percentage. Data missing for Belgium, Croatia, Lithuania, Poland and Romania. Where data are not yet available, the sector share is assumed constant – this is generally the case for 2019 with Spain, Italy, Cyprus and Portugal, the areas of education, health and transport in the Netherlands, as well as with Denmark generally for 2018 and 2019. Slight deviations from the 2018 results are due to a refinement in the estimate of depreciation of infrastructure investment as well as the Brexit-induced recomposition to EU27.
Читать дальшеИнтервал:
Закладка:
Похожие книги на «EIB Investment Report 2020/2021»
Представляем Вашему вниманию похожие книги на «EIB Investment Report 2020/2021» списком для выбора. Мы отобрали схожую по названию и смыслу литературу в надежде предоставить читателям больше вариантов отыскать новые, интересные, ещё непрочитанные произведения.


Обсуждение, отзывы о книге «EIB Investment Report 2020/2021» и просто собственные мнения читателей. Оставьте ваши комментарии, напишите, что Вы думаете о произведении, его смысле или главных героях. Укажите что конкретно понравилось, а что нет, и почему Вы так считаете.