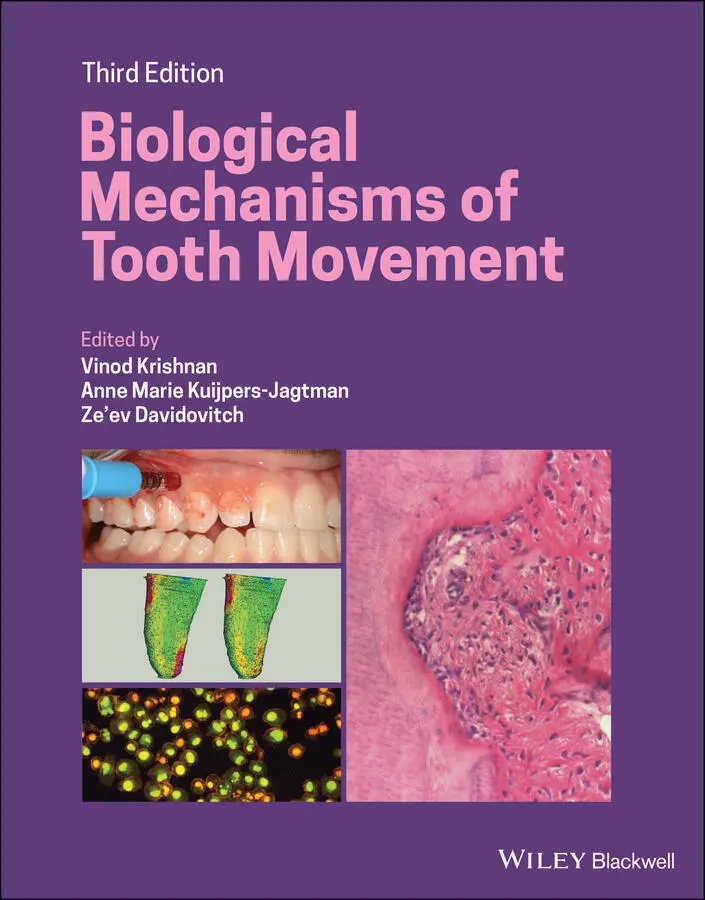
Biological Mechanisms of Tooth Movement
Здесь есть возможность читать онлайн «Biological Mechanisms of Tooth Movement» — ознакомительный отрывок электронной книги совершенно бесплатно, а после прочтения отрывка купить полную версию. В некоторых случаях можно слушать аудио, скачать через торрент в формате fb2 и присутствует краткое содержание. Жанр: unrecognised, на английском языке. Описание произведения, (предисловие) а так же отзывы посетителей доступны на портале библиотеки ЛибКат.
- Название:Biological Mechanisms of Tooth Movement
- Автор:
- Жанр:
- Год:неизвестен
- ISBN:нет данных
- Рейтинг книги:5 / 5. Голосов: 1
-
Избранное:Добавить в избранное
- Отзывы:
-
Ваша оценка:
Biological Mechanisms of Tooth Movement: краткое содержание, описание и аннотация
Предлагаем к чтению аннотацию, описание, краткое содержание или предисловие (зависит от того, что написал сам автор книги «Biological Mechanisms of Tooth Movement»). Если вы не нашли необходимую информацию о книге — напишите в комментариях, мы постараемся отыскать её.
delivers a comprehensive reference for orthodontic trainees and specialists.
It is fully updated to include new chapters on personalized orthodontics as well as the inflammatory process occurring in the dental and paradental tissues. It is heavily illustrated throughout, making it easier for readers to understand and retain the information discussed within. The topics covered range from bone biology, the effects of mechanical loading on tissues and cells, genetics, tissue remodeling, and the effects of diet, drugs, and systemic diseases.
The Third Edition of
features seven sections that cover subjects such as:
The development of biological concepts in orthodontics, including the cellular and molecular biology behind orthodontic tooth movement Mechanics meets biology, including the effects of mechanical loading on hard and soft tissues and cells, and biological reactions to temporary anchorage devices Inflammation and orthodontics, including markers for tissue remodeling in the gingival crevicular fluid and saliva Personalized diagnosis and treatment based on genomic criteria, including the genetic influences on orthodontic tooth movement Rapid orthodontics, including methods to accelerate or decelerate orthodontic tooth movement Perfect for residents and PhD students of orthodontic and periodontal programs,
is also useful to academics, clinicians, bone biologists, and researchers with an interest in the mechanics and biology of tooth movement.
Biological Mechanisms of Tooth Movement — читать онлайн ознакомительный отрывок
Ниже представлен текст книги, разбитый по страницам. Система сохранения места последней прочитанной страницы, позволяет с удобством читать онлайн бесплатно книгу «Biological Mechanisms of Tooth Movement», без необходимости каждый раз заново искать на чём Вы остановились. Поставьте закладку, и сможете в любой момент перейти на страницу, на которой закончили чтение.
Интервал:
Закладка:
16 Index
17 End User License Agreement
List of Tables
1 Chapter 4 Table 4.1 Difference in response of PDL and alveolar bone to light and heavy ... Table 4.2 Inflammatory factors from PDL in response to OTM. Table 4.3 Inflammatory responses in dental pulp in response to orthodontic fo...
2 Chapter 7Table 7.1 The sex hormones have different effects on the osteogenic response ...
3 Chapter 11Table 11.1 Example GCF markers that have been correlated to orthodontic mecha...
4 Chapter 12Table 12.1 Molecules associated with OTM.
5 Chapter 15Table 15.1 Effects of various substances on bone and the PDL and the effect o...
6 Chapter 16Table 16.1 Different types of corticotomyTable 16.2 Indications for open flap technique and MOPsTable 16.3 Different types of bone graftsTable 16.4 Facts and challenges with corticotomies.
7 Chapter 18Table 18.1 Iatrogenic effects of orthodontic force application and mechanics.Table 18.2 Modified guidelines for periodontal follow‐up during orthodontic c...Table 18.3 Actions required following different periodontal findings (PD, poc...
8 Chapter 20Table 20.1 Common cell lines and recommended growth media. (Source: Adapted f...Table 20.2 Research methods in tooth‐movement biology.
List of Illustrations
1 Chapter 1 Figure 1.1 Ancient Greek marble statue of a man’s head. Figure 1.2 Contemporary bust sculpture of a shrine guardian, Seoul, Korea. Figure 1.3 Aulus Cornelius Celsus (25 BCE–50 CE). Figure 1.4 (a) Pierre Fauchard (1678–1761), the father of dentistry and orth... Figure 1.5 (a) Dental pelican forceps (resembling a pelican’s beak).(b) ... Figure 1.6 Norman William Kingsley (1829–1913). Figure 1.7 The front page of the book A Treatise on the Irregularities of th ... Figure 1.8 Carl Sandstedt (1860–1904), the father of biology of orthodontic ... Figure 1.9 A figure from Carl Sandstedt’s historical article in 1904, presen... Figure 1.10 Albert Ketcham (1870–1935), who presented the first radiographic... Figure 1.11 Kaare Reitan (1903–2000), who conducted thorough histological ex... Figure 1.12 A 6 μm sagittal section of a frozen, unfixed, nondemineralized c... Figure 1.13 A 6 μm sagittal section of a cat maxillary canine, after 28 days... Figure 1.14 The mesial (PDL tension) side of the tooth shown in Figure 1.13.... Figure 1.15 The constriction of a blood vessel by the periodontal fibers. Th... Figure 1.16 A 6 μm sagittal section of a cat maxilla, unfixed and nondeminer... Figure 1.17 A 6 μm sagittal section of the same maxilla shown in Figure 1.16... Figure 1.18 Immunohistochemical staining for cyclic AMP in a 6 μm sagittal s... Figure 1.19 Staining for cyclic AMP in a 6 μm sagittal section of a cat maxi... Figure 1.20 Staining for cyclic AMP in the tension zone of the PDL after 7 d... Figure 1.21 Immunohistochemical staining for IL‐1β in PDL and alveolar bone ... Figure 1.22 Staining for IL‐1β in PDL and alveolar bone surface cells after ...
2 Chapter 2 Figure 2.1 Page 1 from Sandstedt’s original article on histological studies ... Figure 2.2 Plate I from Sandstedt’s original article showing photographs of ... Figure 2.3 Plate III from Sandstedt’s original article showing horizontal se... Figure 2.4 Plate IV A from Sandstedt’s original article. These sections show... Figure 2.5 Plate IV B from Sandstedt’s original article. Sandstedt’s Figure ... Figure 2.6 Histologic section from the original article by Oppenheim (1911).... Figure 2.7 Elongation from the original article by Oppenheim (2011). Apex of... Figure 2.8 Second degree of biologic effect seen on the (a) marginal side of... Figure 2.9 Third degree of biologic effect as portrayed in Schwarz article (... Figure 2.10 Fourth degree of biologic effect as portrayed in Schwarz article... Figure 2.11 Comparative diagram of the theories put forward by Sandstedt (19... Figure 2.12 Higher magnification image from Oppenheim’s article (1944) showi... Figure 2.13 Higher magnification image of hemorrhage as portrayed in Oppenhe... Figure 2.14 Hyalinization reaction as portrayed in Oppenheim (1944). The ost... Figure 2.15 Cell free areas as shown by Reitan (1960). The figure shows pres... Figure 2.16 (A) Formation of cells and capillaries in hyalinized tissue afte... Figure 2.17 The constriction of a blood vessel by the periodontal fibers. Th... Figure 2.18 The lodgment of minute gas bubbles at small radii of curvature. ... Figure 2.19 Behavior of bone during orthodontic tooth movement. The net forc... Figure 2.20 Results of a typical intact bone‐streaming potential (mV) in pH ... Figure 2.21 Transverse section, 6 μm thick, of a 1‐year‐old female cat’s man... Figure 2.22 Transverse section, 6 μm thick, of a 1‐year‐old female cat’s man... Figure 2.23 Constant direct current, 20 μA, noninvasively, to the gingival a... Figure 2.24 The number of alveolar bone osteoblasts bordering the PDL (±SEM)...
3 Chapter 3 Figure 3.1 Photomicrographs of the normal PDL in a dog, showing the main ori... Figure 3.2 Photomicrograph of the bone matrix, showing osteocyte lacuna and ... Figure 3.3 Fluid flow (arrows) after the application of an orthodontic force... Figure 3.4 The transposition of a dog premolar during the first 5 hours afte... Figure 3.5 Integrin and its subunits. Figure 3.6 The focal adhesion complex. Figure 3.7 The nucleus‐related part of the cytoskeleton. Figure 3.8 General time–displacement curve of OTM. Figure 3.9 Photomicrograph of the PDL after orthodontic force application fo... Figure 3.10 Photomicrographs of the leading side of orthodontically moving p... Figure 3.11 Photomicrograph of the trailing side of orthodontically moving p... Figure 3.12 Summary of the remodeling processes at the leading side. Fibrobl... Figure 3.13 The RANK/RANKL/OPG system. The RANKL that is secreted by fibrobl... Figure 3.14 An active osteoclast. Figure 3.15 Summary of the remodeling processes at the trailing side. Fibrob... Figure 3.16 Theoretical model of orthodontic tooth movement (OTM) based on t...
4 Chapter 4 Figure 4.1 Initial effects of orthodontic forces on paradental tissues. Figure 4.2 Immunohistochemical localization of the cytokine IL‐1α in a 6 μm ... Figure 4.3 Immunohistochemical staining for RANKL in PDL after 7 days during... Figure 4.4 Immunohistochemical staining for CGRP in cat PDL after canine ret... Figure 4.5 (a) Schematic presentation of inflammation in the PDL cells resul...
5 Chapter 5 Figure 5.1 The cellular and molecular pathways, starting with strain relaxat... Figure 5.2 A longitudinal section of the cervical part of the tooth presenti...
6 Chapter 6Figure 6.1 Genetic patterning to produce craniofacial ossification centers i...Figure 6.2 Endochondral bone formation via hyaline cartilage is associated w...Figure 6.3 Intramembranous bone formation produces a woven or lamellar struc...Figure 6.4 Vascular invasion of the cartilage anlage for a long bone occurs ...Figure 6.5 A wedge of a cortical bone that is growing to the left demonstrat...Figure 6.6 The early postnatal growth of the maxillary complex up until the ...Figure 6.7 An enlarged drawing demonstrates the primary growth mechanism of ...Figure 6.8 After the body of the mandible forms by the intramembranous mecha...Figure 6.9 A photomicrograph of a cross‐section through the mandible of a mo...Figure 6.10 The concentric pairs of bright lines (arrows) are double tetracy...Figure 6.11 A series of multifluorochome labels at 7‐day intervals in rabbit...Figure 6.12 A series of multiple fluorochrome labels at 2‐week intervals dem...Figure 6.13 The integration of anabolic and catabolic modeling (M) activity ...Figure 6.14 A longitudinal section through a cutting/filling cone in cortica...Figure 6.15 The bone physiology associated with translation of a tooth. Note...Figure 6.16 With respect to environmental adaptation of bone, the basic cell...Figure 6.17 The vascular origin of bone cells. Note that osteoclasts are der...Figure 6.18 (a) A hemisection of a cutting/filling cone moving to the left d...Figure 6.19 Frost’s mechanostat shows the relationship of dynamic loading an...Figure 6.20 (a) A Trabecular bone remodeling over a 1‐year interval shows th...Figure 6.21 Trabecular bone remodeling in the vertebrae in a rat: multiple f...Figure 6.22 Early postnatal development of the craniofacial complex involves...Figure 6.23 Late postnatal development of the face is under functional influ...Figure 6.24 TMJ development in the prenatal period involves the primary grow...Figure 6.25 Continuous osseous adaptation of the TMJ occurs over a lifetime ...Figure 6.26 The mandibular condyle and the temporal fossa of the TMJ can cha...Figure 6.27 Premolar movement to the right in a monkey illustrates frontal b...Figure 6.28 Initiation of tooth movement is a set of bone modeling reactions...Figure 6.29 (a) The histological picture of undermining remodeling is relate...Figure 6.30 In the direction of tooth movement, catabolic and anabolic model...Figure 6.31 Subperiosteal formation in the direction of tooth movement is a ...Figure 6.32 During progressive tooth movement, PDL catabolic modeling is dri...Figure 6.33 As the tooth moves away from the supporting alveolar bone, catab...
Читать дальшеИнтервал:
Закладка:
Похожие книги на «Biological Mechanisms of Tooth Movement»
Представляем Вашему вниманию похожие книги на «Biological Mechanisms of Tooth Movement» списком для выбора. Мы отобрали схожую по названию и смыслу литературу в надежде предоставить читателям больше вариантов отыскать новые, интересные, ещё непрочитанные произведения.


Обсуждение, отзывы о книге «Biological Mechanisms of Tooth Movement» и просто собственные мнения читателей. Оставьте ваши комментарии, напишите, что Вы думаете о произведении, его смысле или главных героях. Укажите что конкретно понравилось, а что нет, и почему Вы так считаете.