Caner Ozdemir - Inverse Synthetic Aperture Radar Imaging With MATLAB Algorithms
Здесь есть возможность читать онлайн «Caner Ozdemir - Inverse Synthetic Aperture Radar Imaging With MATLAB Algorithms» — ознакомительный отрывок электронной книги совершенно бесплатно, а после прочтения отрывка купить полную версию. В некоторых случаях можно слушать аудио, скачать через торрент в формате fb2 и присутствует краткое содержание. Жанр: unrecognised, на английском языке. Описание произведения, (предисловие) а так же отзывы посетителей доступны на портале библиотеки ЛибКат.
- Название:Inverse Synthetic Aperture Radar Imaging With MATLAB Algorithms
- Автор:
- Жанр:
- Год:неизвестен
- ISBN:нет данных
- Рейтинг книги:5 / 5. Голосов: 1
-
Избранное:Добавить в избранное
- Отзывы:
-
Ваша оценка:
Inverse Synthetic Aperture Radar Imaging With MATLAB Algorithms: краткое содержание, описание и аннотация
Предлагаем к чтению аннотацию, описание, краткое содержание или предисловие (зависит от того, что написал сам автор книги «Inverse Synthetic Aperture Radar Imaging With MATLAB Algorithms»). Если вы не нашли необходимую информацию о книге — напишите в комментариях, мы постараемся отыскать её.
covers in greater detail the fundamental and advanced topics necessary for a complete understanding of inverse synthetic aperture radar (ISAR) imaging and its concepts. Distinguished author and academician, Caner Özdemir, describes the practical aspects of ISAR imaging and presents illustrative examples of the radar signal processing algorithms used for ISAR imaging. The topics in each chapter are supplemented with MATLAB codes to assist readers in better understanding each of the principles discussed within the book.
This new edition incudes discussions of the most up-to-date topics to arise in the field of ISAR imaging and ISAR hardware design. The book provides a comprehensive analysis of advanced techniques like Fourier-based radar imaging algorithms, and motion compensation techniques along with radar fundamentals for readers new to the subject.
The author covers a wide variety of topics, including:
Radar fundamentals, including concepts like radar cross section, maximum detectable range, frequency modulated continuous wave, and doppler frequency and pulsed radar The theoretical and practical aspects of signal processing algorithms used in ISAR imaging The numeric implementation of all necessary algorithms in MATLAB ISAR hardware, emerging topics on SAR/ISAR focusing algorithms such as bistatic ISAR imaging, polarimetric ISAR imaging, and near-field ISAR imaging, Applications of SAR/ISAR imaging techniques to other radar imaging problems such as thru-the-wall radar imaging and ground-penetrating radar imaging Perfect for graduate students in the fields of electrical and electronics engineering, electromagnetism, imaging radar, and physics,
also belongs on the bookshelves of practicing researchers in the related areas looking for a useful resource to assist them in their day-to-day professional work.
Inverse Synthetic Aperture Radar Imaging With MATLAB Algorithms — читать онлайн ознакомительный отрывок
Ниже представлен текст книги, разбитый по страницам. Система сохранения места последней прочитанной страницы, позволяет с удобством читать онлайн бесплатно книгу «Inverse Synthetic Aperture Radar Imaging With MATLAB Algorithms», без необходимости каждый раз заново искать на чём Вы остановились. Поставьте закладку, и сможете в любой момент перейти на страницу, на которой закончили чтение.
Интервал:
Закладка:
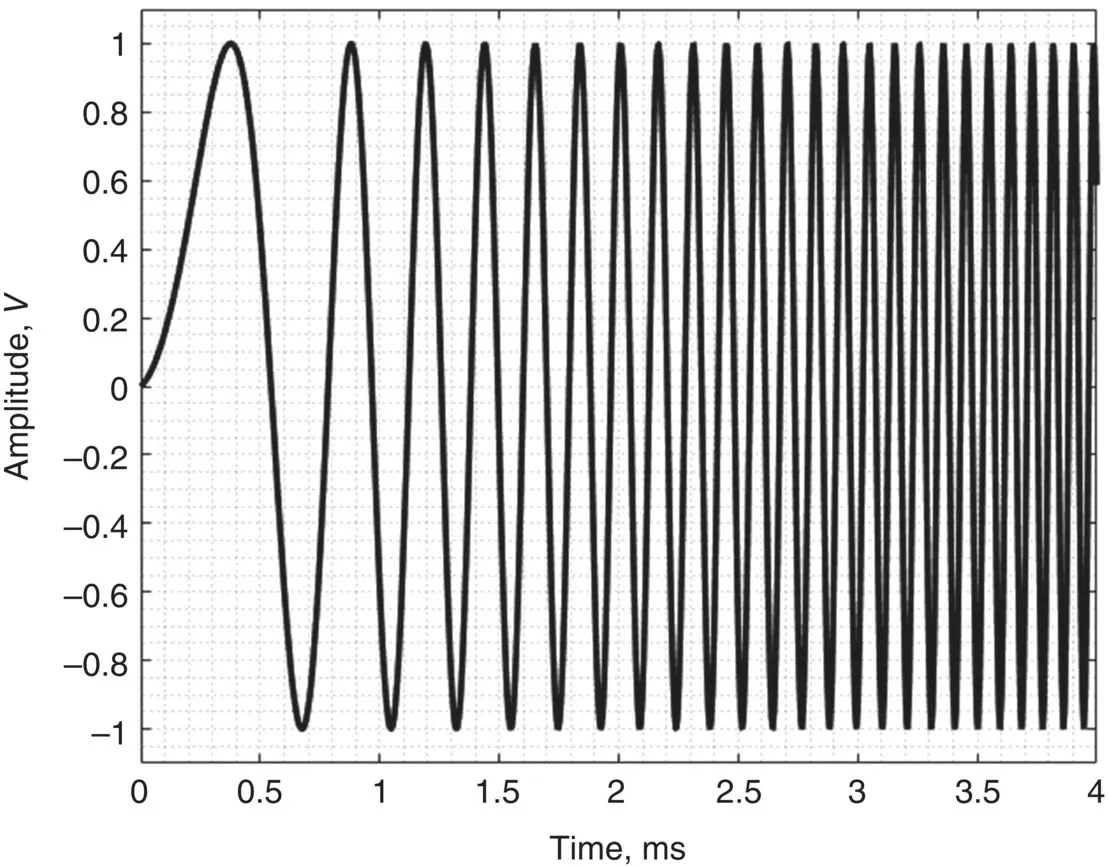
Figure 2.11 A linear frequency‐modulated continuous wave signal.
In FMCW radar operation, consecutive LFM signals are transmitted by the radar. If the period of serial LFM waves is T , the frequency variation of such waveforms can be represented as in Figure 2.12a. The received signal arrives with a time delay of t d. This time delay can be determined in the following manner: The difference in the frequency between the transmitted and the received signals, Δ f , can be found as below:
(2.47) 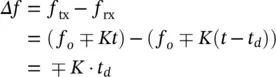
Of course, time delay t dis related to the range, R , of the target by the following equation:
(2.48) 
where c is the speed of light in the air. Combining Eqs. 2.47and 2.48, it is easy to determine the range of the target via
(2.49) 
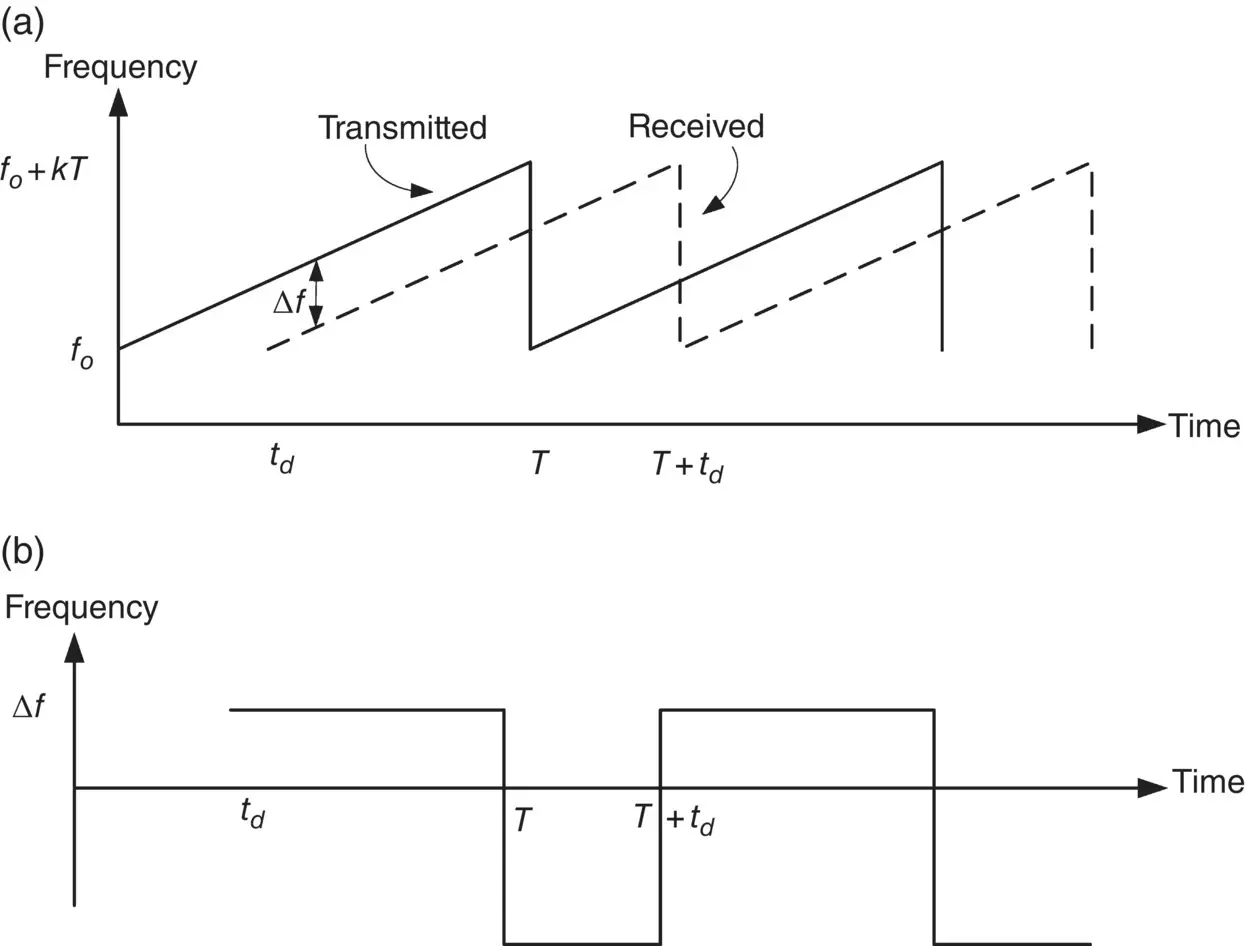
Figure 2.12 Operation of LFMCW radar: (a) time‐frequency display of the transmitted and received LFMCW signals, (b) the difference in the frequency between the transmitted and the received signals.
The block diagram of linear frequency‐modulated continuous wave (LFMCW) radar is shown in Figure 2.13. The LFMCW generator produces the LFM signal to be broadcasted by the transmitter. The receiver collects the returned wave that is multiplied with the transmitted signal. The output has both the sum and the difference of the transmitted and the received frequencies. As shown in Figure 2.12b, only the positive frequency difference, Δ f is selected. Then the signal is fed to a discriminator that contains a differentiator plus an envelope detector. The output of the discriminator is proportional to the frequency difference, Δ f . Once Δ f is obtained, the range, R , of the target can be easily obtained via Eq. 2.50.
It is also obvious from Figure 2.12that range ambiguity occurs when t d> T . Therefore, the maximum difference in frequency can be Δ f max= KT , which means that the maximum unambiguous range can be determined as
(2.50) 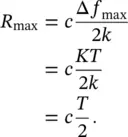
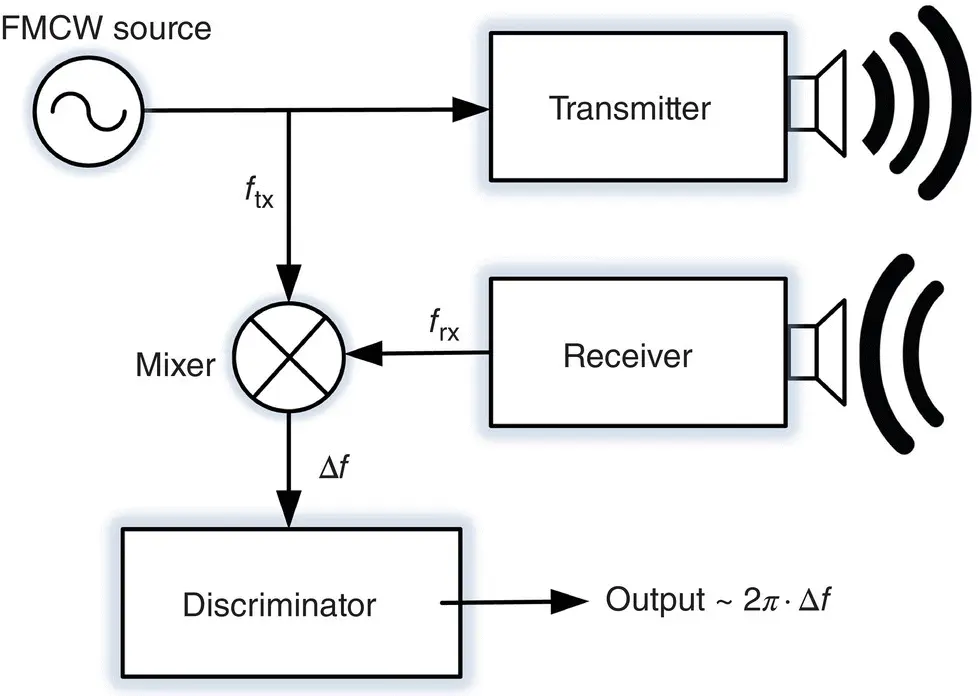
Figure 2.13 LFMCW radar block diagram.
The above equation suggests that FMCW radar can only be used for short‐ or mid‐range detection of objects. Therefore, it is not suitable for long‐range detection.
2.6.3 Stepped‐Frequency Continuous Wave
Another popular radar waveform used to determine the range is the SFCW. This signal is formed by emitting a series of single‐frequency short continuous subwaves. In generating the SFCW signal, the frequencies between adjacent subwaves are increased by an incremental frequency of Δ f as demonstrated in Figure 2.14. For one burst of SFCW signal, a total of N CW signals, each having a discrete frequency of f n= f o+ ( n − 1)·Δ f , is sent. Each subwave has a time duration of τ and is of T distance away from the adjacent subwave. The total frequency bandwidth, B , and the frequency increment (or resolution), Δ f , can be readily calculated as below:
(2.51) 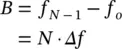
(2.52) 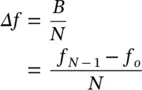
The SFCW signal can be used to estimate the range of a possible target in the following manner. Suppose that the target is at the range distance of R ofrom the radar. With a single measurement of monostatic SFCW radar, the phase of the backscattered wave is proportional to the range as given in the following equation:
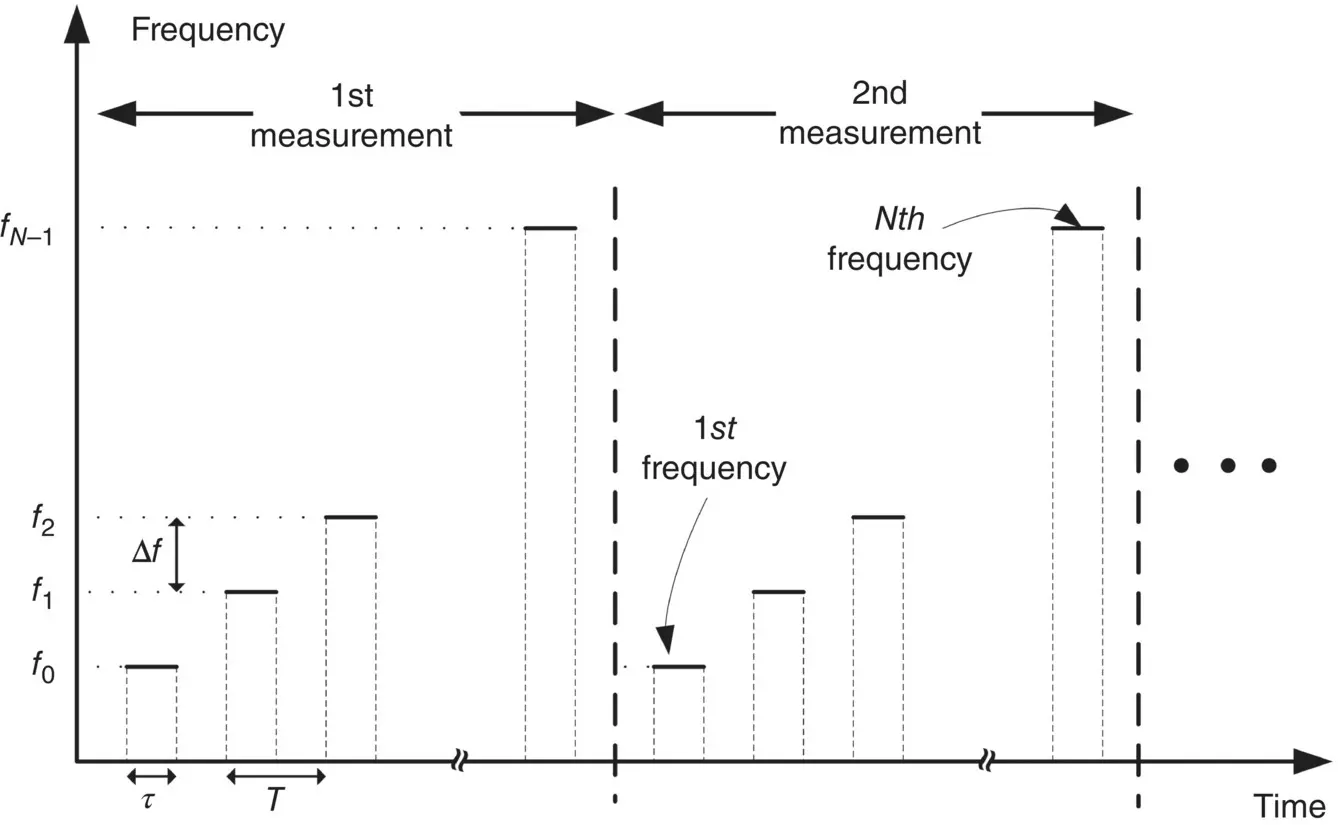
Figure 2.14 SFCW signal in time‐frequency plane.
(2.53) 
Here, E sis the scattered electric field, A is the scattered field amplitude, and kis the wavenumber vector corresponding to the frequency vector of f= [ f o f 1 f 2⋯ f N−1]. The number 2 in the phase corresponds to the two‐way propagation between radar‐ to‐ target and target to radar. It is obvious that there is FT relationship between (2 k) and ( R ). Therefore, it is possible to resolve the range, R o, by taking the inverse Fourier transform (IFT) of the output of the SFCW radar. The resulted signal is nothing but the range profile of the target. The range resolution is determined by the Fourier theory as
(2.54) 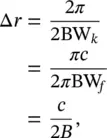
where BW kand BW f≜ B are the bandwidths in wavenumber and frequency domains, respectively. The maximum range is then determined by multiplying the range resolution by the number of SFCW pulses:
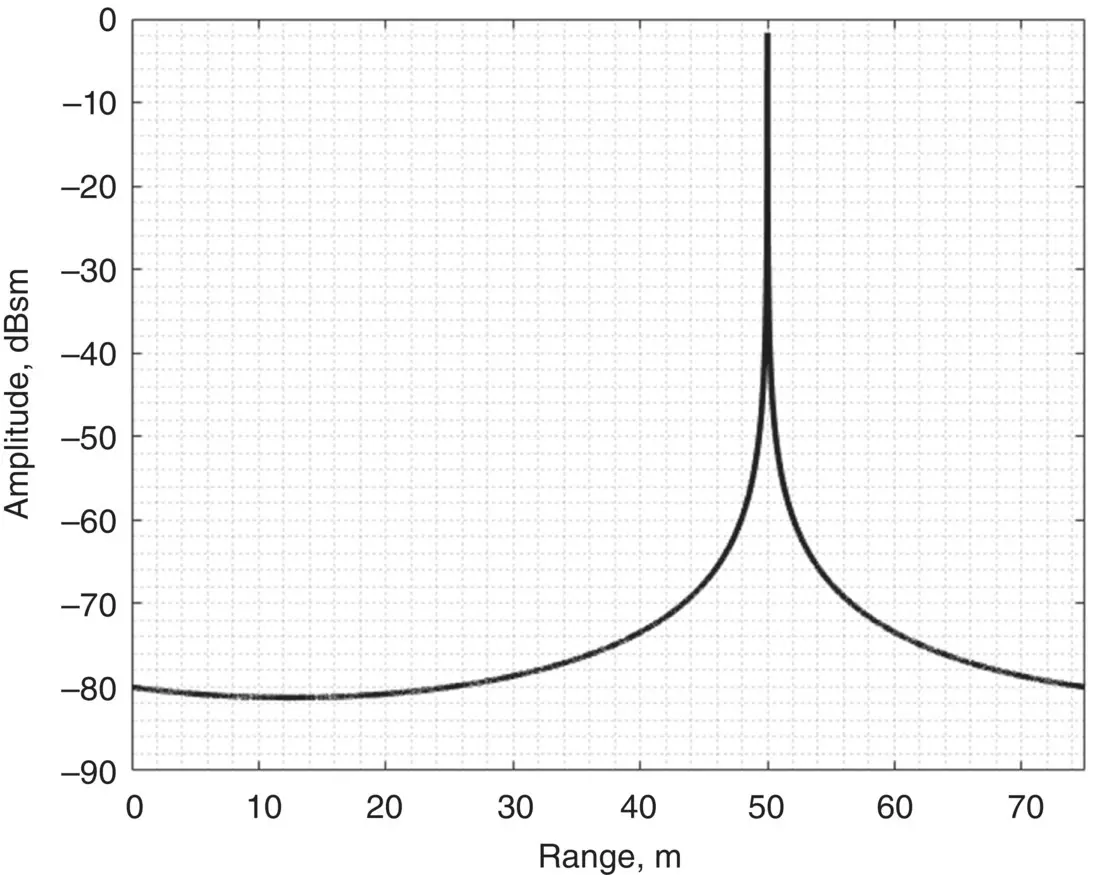
Figure 2.15 Range profile of a point target is obtained with the help of SFCW radar processing.
(2.55) 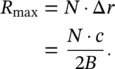
We will demonstrate the operation of SFCW radar with an example. Let us consider a point target which is 50 m away from the radar. Suppose that the SFCW radar's frequencies change from 2 to 22 GHz with the frequency increments of 2 MHz. Using Eqs. 2.54and 2.55, one can easily find the range resolution and the maximum range as 0.75 cm and 75 m, respectively. Applying the Matlab routine “ Figure 2.15.m” to the synthetic backscattered data, the range profile of this point target can be obtained as plotted in Figure 2.15. It is clearly seen from the figure that the point target at the range of 50 m is perfectly pinpointed.
Читать дальшеИнтервал:
Закладка:
Похожие книги на «Inverse Synthetic Aperture Radar Imaging With MATLAB Algorithms»
Представляем Вашему вниманию похожие книги на «Inverse Synthetic Aperture Radar Imaging With MATLAB Algorithms» списком для выбора. Мы отобрали схожую по названию и смыслу литературу в надежде предоставить читателям больше вариантов отыскать новые, интересные, ещё непрочитанные произведения.


Обсуждение, отзывы о книге «Inverse Synthetic Aperture Radar Imaging With MATLAB Algorithms» и просто собственные мнения читателей. Оставьте ваши комментарии, напишите, что Вы думаете о произведении, его смысле или главных героях. Укажите что конкретно понравилось, а что нет, и почему Вы так считаете.