Daniel J. Denis - Applied Univariate, Bivariate, and Multivariate Statistics
Здесь есть возможность читать онлайн «Daniel J. Denis - Applied Univariate, Bivariate, and Multivariate Statistics» — ознакомительный отрывок электронной книги совершенно бесплатно, а после прочтения отрывка купить полную версию. В некоторых случаях можно слушать аудио, скачать через торрент в формате fb2 и присутствует краткое содержание. Жанр: unrecognised, на английском языке. Описание произведения, (предисловие) а так же отзывы посетителей доступны на портале библиотеки ЛибКат.

- Название:Applied Univariate, Bivariate, and Multivariate Statistics
- Автор:
- Жанр:
- Год:неизвестен
- ISBN:нет данных
- Рейтинг книги:5 / 5. Голосов: 1
-
Избранное:Добавить в избранное
- Отзывы:
-
Ваша оценка:
Applied Univariate, Bivariate, and Multivariate Statistics: краткое содержание, описание и аннотация
Предлагаем к чтению аннотацию, описание, краткое содержание или предисловие (зависит от того, что написал сам автор книги «Applied Univariate, Bivariate, and Multivariate Statistics»). Если вы не нашли необходимую информацию о книге — напишите в комментариях, мы постараемся отыскать её.
contains an accessible introduction to statistical modeling techniques commonly used in the social and behavioral sciences. The text offers a blend of statistical theory and methodology and reviews both the technical and theoretical aspects of good data analysis.
Featuring applied resources at various levels, the book includes statistical techniques using software packages such as R and SPSS®. To promote a more in-depth interpretation of statistical techniques across the sciences, the book surveys some of the technical arguments underlying formulas and equations. The thoroughly updated edition includes new chapters on nonparametric statistics and multidimensional scaling, and expanded coverage of time series models. The second edition has been designed to be more approachable by minimizing theoretical or technical jargon and maximizing conceptual understanding with easy-to-apply software examples. This important text:
Offers demonstrations of statistical techniques using software packages such as R and SPSS® Contains examples of hypothetical and real data with statistical analyses Provides historical and philosophical insights into many of the techniques used in modern social science Includes a companion website that includes further instructional details, additional data sets, solutions to selected exercises, and multiple programming options Written for students of social and applied sciences,
offers a text to statistical modeling techniques used in social and behavioral sciences.
Applied Univariate, Bivariate, and Multivariate Statistics — читать онлайн ознакомительный отрывок
Ниже представлен текст книги, разбитый по страницам. Система сохранения места последней прочитанной страницы, позволяет с удобством читать онлайн бесплатно книгу «Applied Univariate, Bivariate, and Multivariate Statistics», без необходимости каждый раз заново искать на чём Вы остановились. Поставьте закладку, и сможете в любой момент перейти на страницу, на которой закончили чтение.
Интервал:
Закладка:
The key point is that when we are working with expectations, we are working with probabilities. Thus, instead of summing squared deviations of the kind  as one does in the sample or population variance for which there is specified n , one must rather assign to these squared deviations probabilities, which is what is essentially being communicated by the notation “ E ( y i− μ ) 2.” We can “unpack” this expression to read
where p ( y i) is the probability of the given deviation, ( y i− μ ), for in this case, a discrete random variable.
2.6 MOMENTS AND EXPECTATIONS
When we speak of momentsof a distribution or of a random variable, we are referring to such things as the mean, variance, skewness, and kurtosis.
The first moment of a distribution is its mean. For a discrete random variable y i, the expectation is given by:
where y iis the given value of the variable, and p ( y i) is its associated probability. When y iis a continuous random variable, the expectation is given by:
Notice again that in both cases, whether the variable is discrete or continuous, we are simply summing productsof values of the variable with its probability, or densityif the variable is continuous. In the case of the discrete variable, the products are “explicit” in that our notation tells us to take each value of y (i.e., y i) and multiply by the probability of that given value, p ( y i). In the case of a continuous variable, the products are a bit more implicitone might say, since the “probability” of any particularvalue in a continuous density is equal to 0. Hence, the product y i p ( y i) is equal to the given value of y imultiplied by its corresponding density.
The arithmetic mean is a point such that  . That is, the sum of deviations around the mean is always equal to 0 for any data set we may consider. In this sense, we say that the arithmetic mean is the center of gravityof a distribution, it is the point that “balances” the distribution (see Figure 2.8).
2.6.1 Sample and Population Mean Vectors
We often wish to analyze data simultaneously on several response variables. For this, we require vector and matrix notation to express our responses. The matrix operations presented here are surveyed more comprehensively in the Appendix and in any book on elementary matrix algebra.

Figure 2.8Because the sum of deviations about the arithmetic mean is always zero, it can be conceptualized as a balance point on a scale.
Consider the following vector:
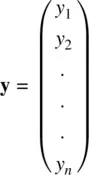
where y 1is observation 1 up to observation y n.
We can write the sample mean vector  for several variables y 1through y pas
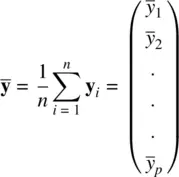
where  is the mean of the p thvariable.
The expectation of individual observations within each vector is equal to the population mean μ , of which the expectation of the sample vector yis equal to the population vector, μ. This is simply an extension of scalar algebra to that of matrices:

Likewise, the expectations of individual sample means  ,
,  , …
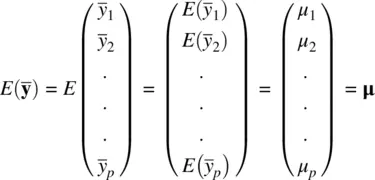
, …  are equal to their population counterparts, μ 1, μ 2, … μ p. The expectation of the sample mean vector
  is equal to the population mean vector, μ:
We note also that  is an unbiasedestimator of μsince
  .
.
Recall that we said that the mean is the first moment of a distribution. We discuss the second moment of a distribution, that of the variance, shortly. Before we do so, a brief discussion of estimation is required.
2.7 ESTIMATION AND ESTIMATORS
The goal of statistical inference is, in general, to estimate parameters of a population. We distinguish between point estimators and interval estimators. A point estimatoris a function of a sample and is used to estimate a parameter in the population. Because estimates generated by estimators will vary from sample to sample, and thus have a probability distribution associated with them, estimators are also often random variables. For example, the sample mean  is an estimator of the population mean μ . However, if we sample a bunch of
  from a population for which μ is the actual population mean, we know, both from experience and statistical theory, that
  will vary from sample to sample. This is why the estimator
  is often a random variable, because its values will each have associated with them a given probability (density) of occurrence. When we use the estimator to obtain a particular number, that number is known as an estimate. An interval estimatorprovides a range of values within which the true parameter is hypothesized to exist within some probability. A popular interval estimator is that of the confidence interval, a topic we discuss later in this chapter.
Интервал:
Закладка:
Похожие книги на «Applied Univariate, Bivariate, and Multivariate Statistics»
Представляем Вашему вниманию похожие книги на «Applied Univariate, Bivariate, and Multivariate Statistics» списком для выбора. Мы отобрали схожую по названию и смыслу литературу в надежде предоставить читателям больше вариантов отыскать новые, интересные, ещё непрочитанные произведения.


Обсуждение, отзывы о книге «Applied Univariate, Bivariate, and Multivariate Statistics» и просто собственные мнения читателей. Оставьте ваши комментарии, напишите, что Вы думаете о произведении, его смысле или главных героях. Укажите что конкретно понравилось, а что нет, и почему Вы так считаете.